Tuesday, September 26, 2006

Natural Gas - A Tale of Two Markets

This post will provide a graphical update on what has been a roller coaster ride in the natural gas market over the past 12 months, and a steep plummet of late. Natural gas prices have dropped by 50% in the last month, and over 70% from their highs earlier in the year. The warmest winter on record and not a single rig-damaging hurricane have combined to create record gas in storage, thereby reducing price demand for the marginal unit. Yet, production is flat with last year despite significant more drilling and rigs allocated to the commodity. The current situation is thus one of short term plenty and long term supply concern. If longer term predictions of reduced supply and accelerated well depletion are correct, we should be seeing some of the major producers reduce rig counts at these levels, or shut-in their production with intent to sell it higher in the future. This post examines the supply/demand equation for natural gas in the US, the NG futures strip, and the implications going forward of higher price volatility in this important commodity.


[break]

(For those unfamiliar with how the energy futures markets work, here is some background info.)


Natural gas. It does everything from heat our homes to fertilize and cook our food. And unless you've lived in a climate that doesn't require air conditioning or heat, you've probably heard of the wild swings in the gas market in the past year. The price drop has caused fits, threats and lost bets. Each day the natural gas market goes up or down. This year, its pretty much gone down.


Click to enlarge.


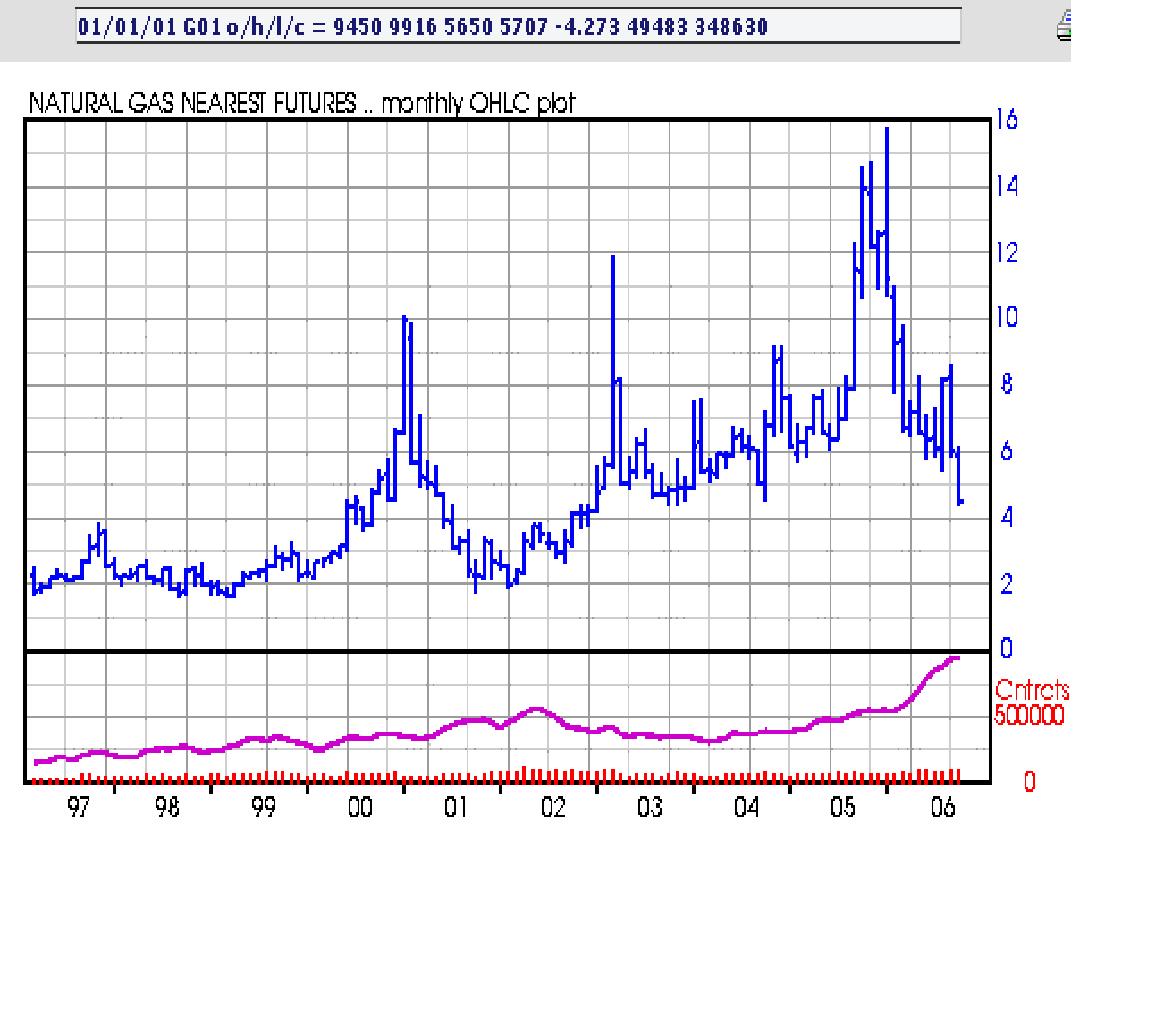
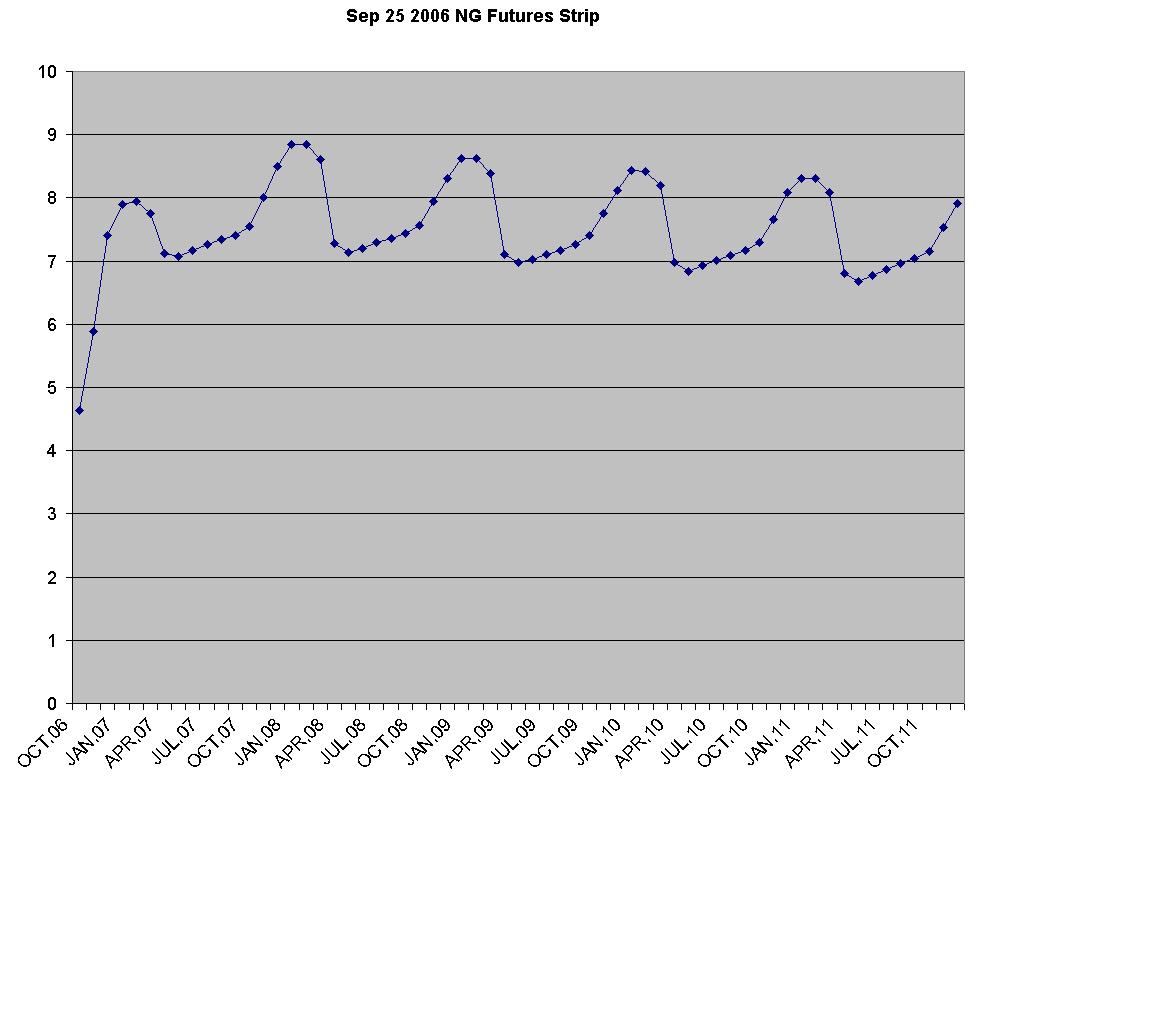
The two markets I refer to in the title are supply and demand. But I could just as easily be referring to the dichotomy between near term prices and long term. The above chart (and most news services (CNBC, etc) quote what the 'front' or near month for oil and gas futures is doing. However, these commodities can be traded for expiration each of the next 60 months. A 'futures strip' is comprised of the entire forward market for a commodity. The complexity of the short and long term supply/demand situation can be better understood by looking at the entire curve. Below is a graphic of the futures strip from NYMEX.com of last fridays close for natural gas. (it was down again on Monday). As can be seen, prices are very low for October and November 2006 then form a sine wave pattern for the next 60 months, with peak prices expected in winter months, when heating demand is high. (Note, the above chart shows historical prices over 10 years, the below chart are todays prices for delivery the next 5 years in the future)


Click to enlarge.


We will return to the futures strip at the end of this post but first give a review of the current dynamics of the natural gas market.


NATURAL GAS SUPPLY


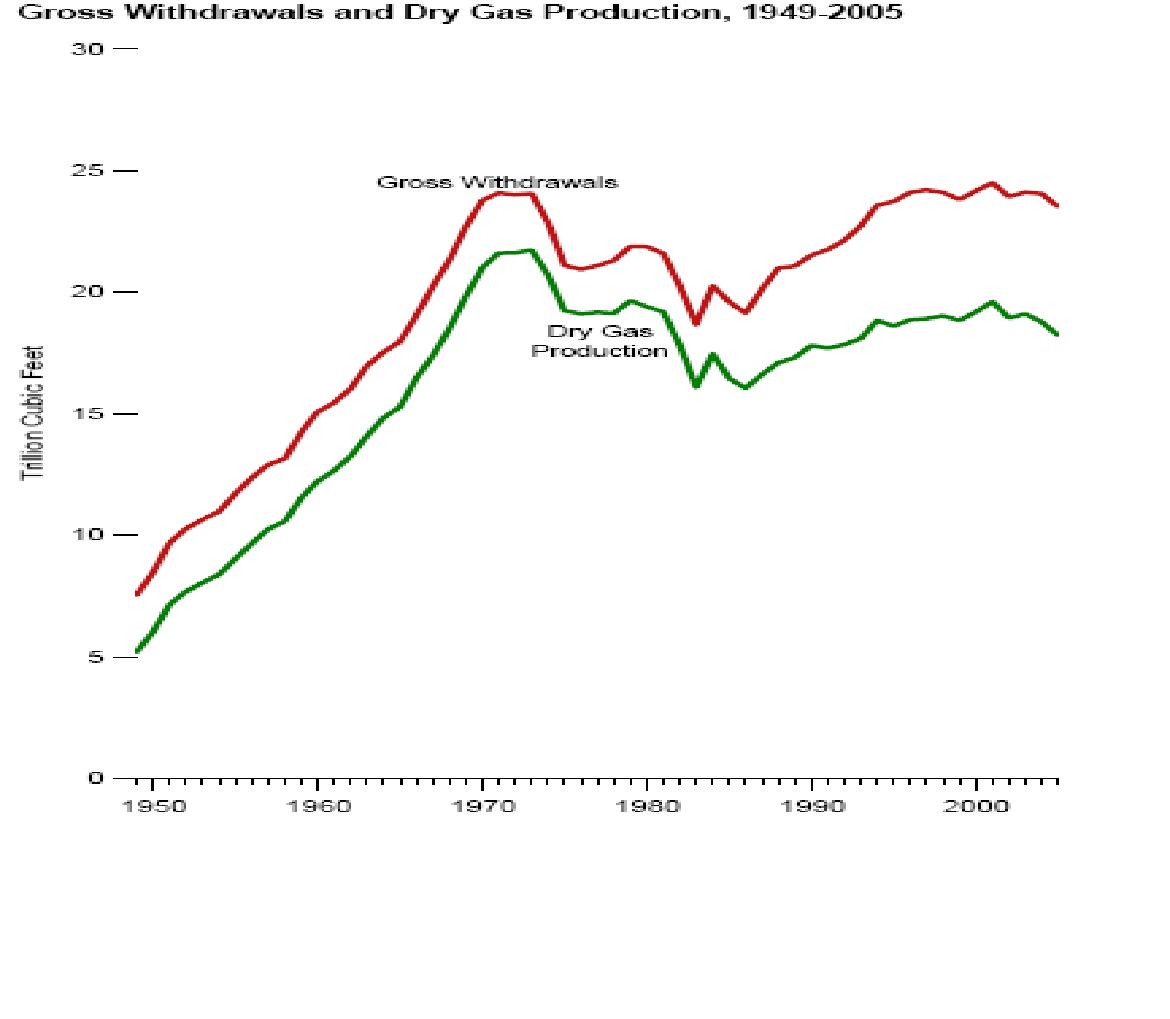
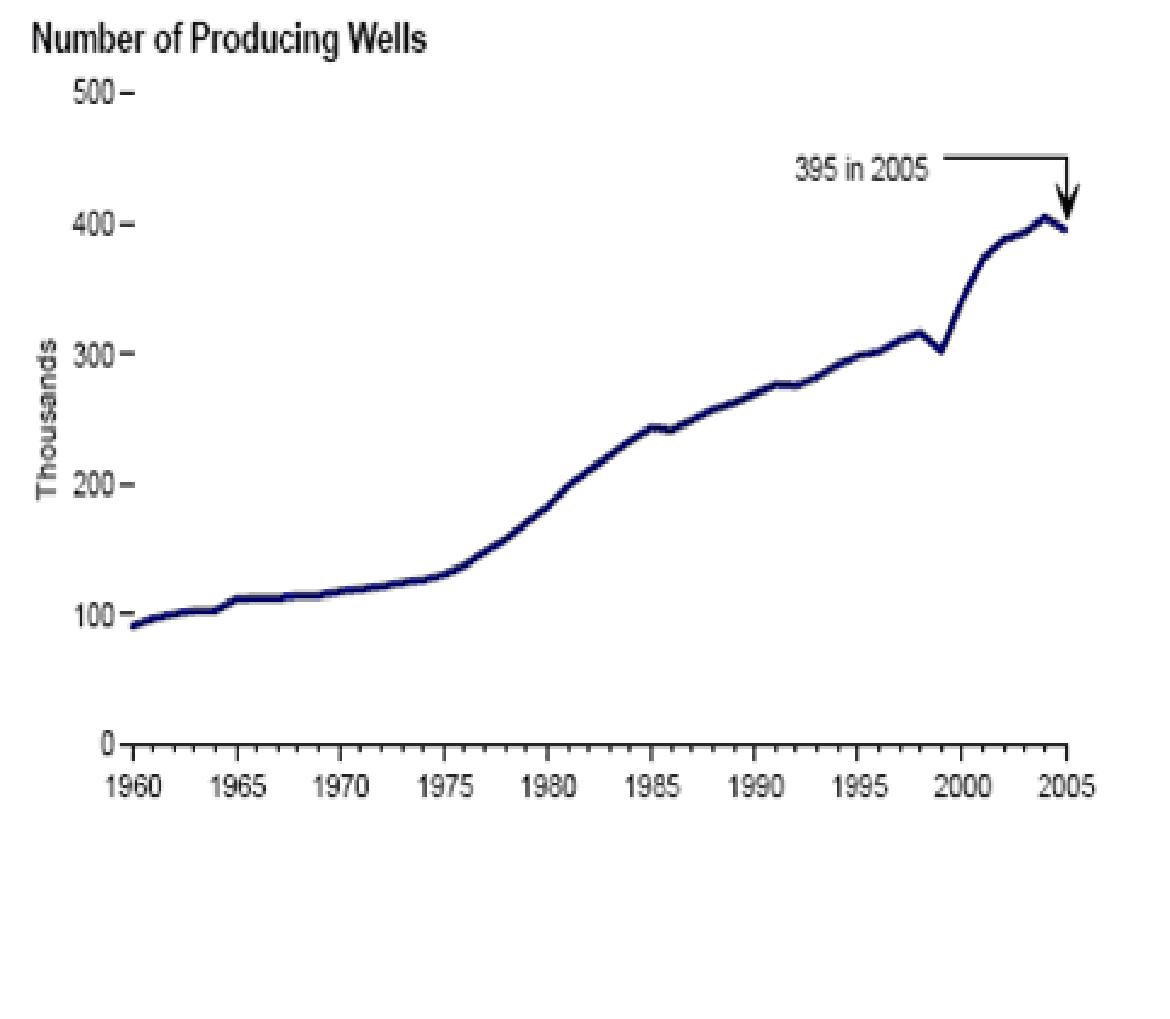
The Peak Oil (and Natural Gas) crowd typically focus their worries on the supply side of the market equation. The supply story for natural gas, at least domestically, does not look promising. The United States has roughly 400,000 natural gas wells operating currently, near an all time high. First of all, lets look at total production in the United States. (The difference in the two lines is the top one includes 'wet gas' or non-gas liquids which are added into the petroleum supplies.) (Source EIA)


Click to enlarge.


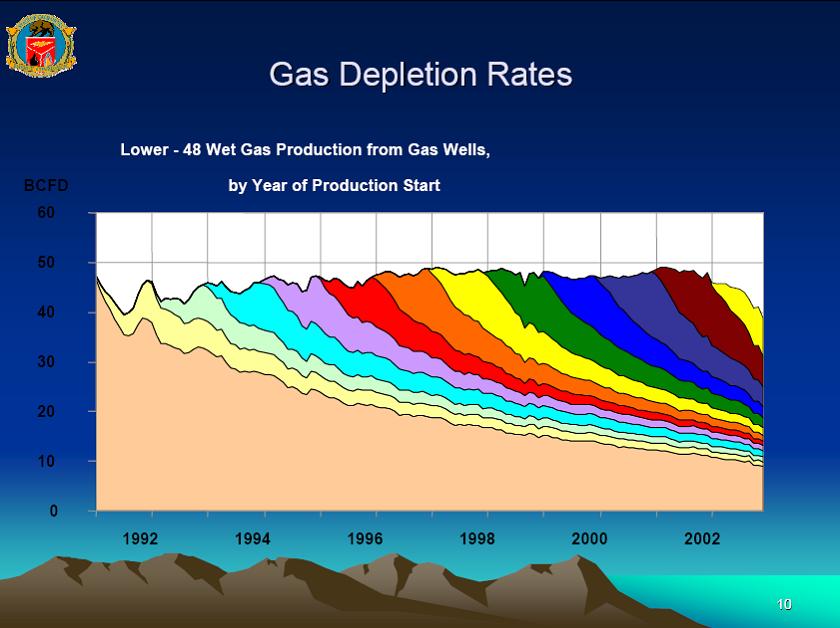
The following is a graphic showing how quickly the average new gas well is depleted. (this is for wet wells but dry wells appear to be depleting slightly faster) As can be seen, a decade ago, it took 10-15 years for a new well to deplete. Now they are going dry in less than 18 months.


Click to enlarge.


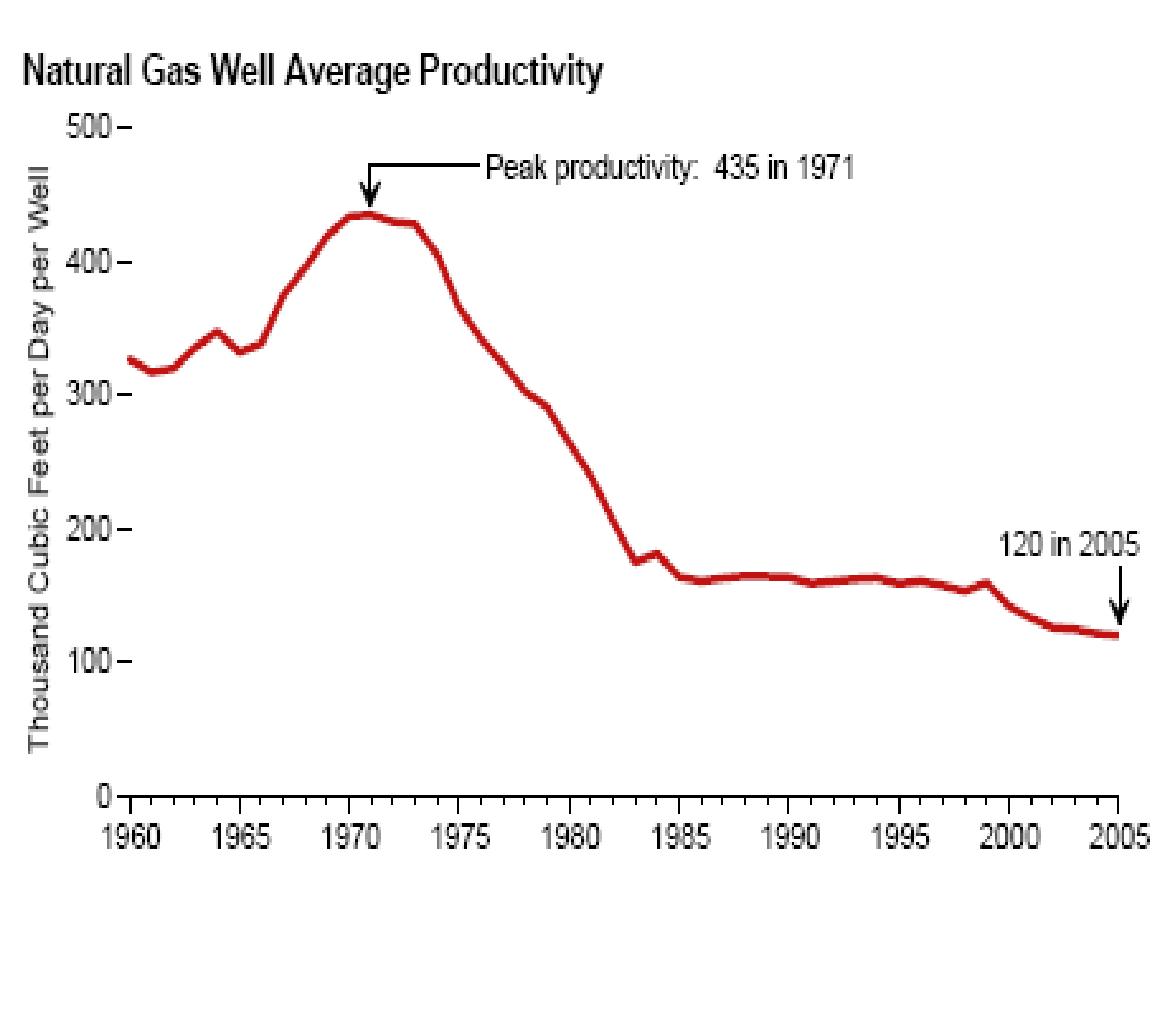
In addition to quicker depletion, wells are smaller and hence less productive: (Source EIA)


Click to enlarge.


We are drilling more wells and smaller wells. Equity research house Johnson Rice recently put out a report showing that from Q2 2005 to Q2 2006, the top 20 NG production firms were down 2.4% in production yet had increased rig count by 22%. (this doesnt include shut-in production).


HELP FROM THE NORTH?


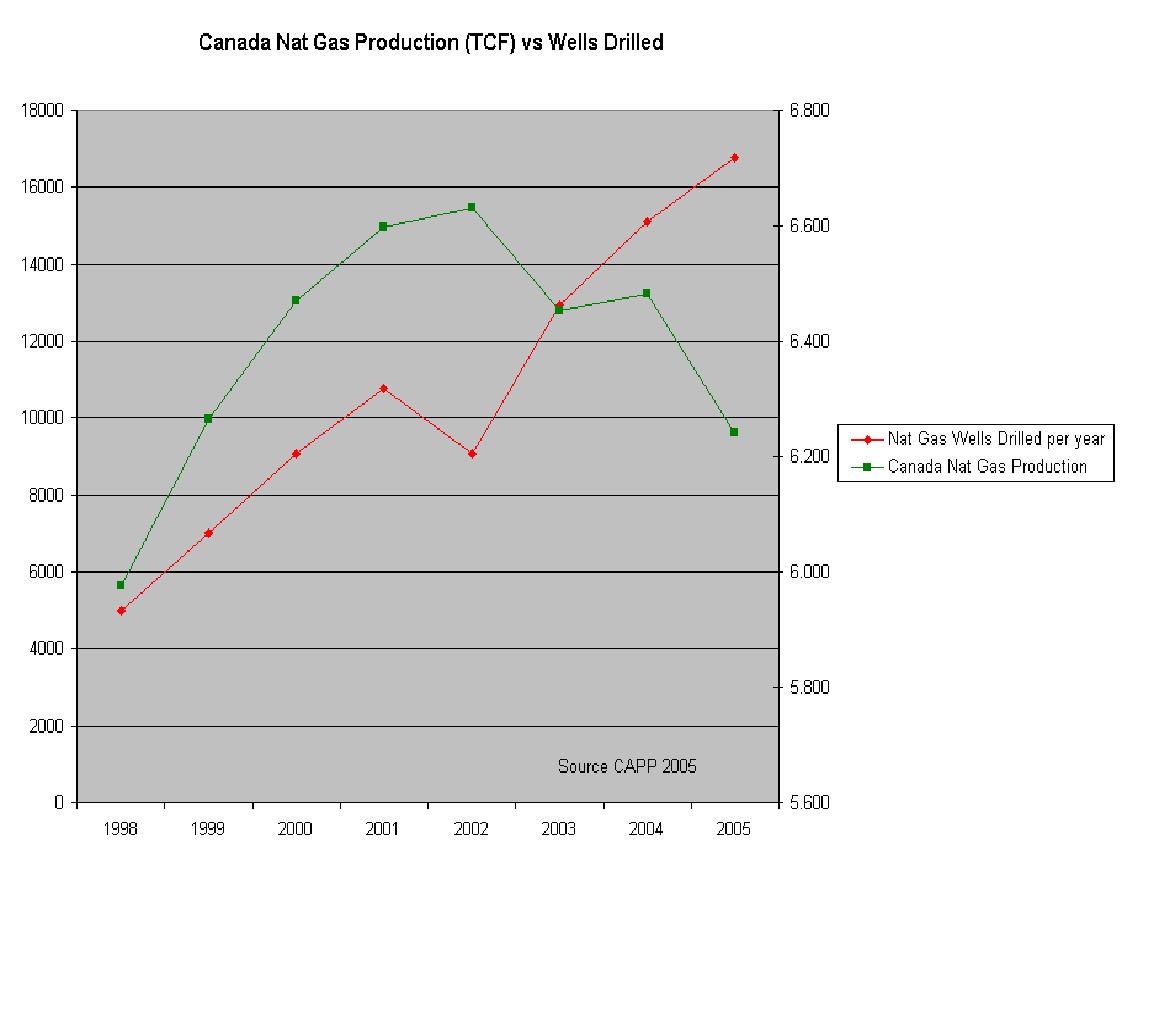
Canada produces about 6.2 TCF per year and exports 3.6 TCF to the United States. However, they too are declining in production with a large increase in wells - a similar pattern to the US. The graph below shows Canada producing about the same amount of NG as in 1998, but needing to drill more than twice the wells annually to do this. (Don't get me started on net energy)


Click to enlarge.


This is a broad sketch of the supply picture - of course there are coal bed methane and liquefied natural gas, but the impact of both is uncertain, and with natural gas currently with a $4 handle, those sources may be uneconomical or not come to market in a timely fashion. To me, the North American natural gas supply situation can best be likened to the Red Queen in Alice in Wonderland, who kept running very fast just to stay in place - if she slowed down, she might go backwards rapidly.


NOT SO FAST MY FRIEND!


Natural gas demand is the other half of the story. The US (in 2005) used just under 22 trillion cubic feet of natural gas. Believe it or not, this is less than we used 10 years ago (compared to a 13% increase in crude oil).


The 22 TCF roughly breaks down as follows: 24% for residential heating, 14% for commercial use, 35% for industrial use, and 27% for electric and combined cycle power.


Click to enlarge.


Though many say that closure of industrial and chemical plants domestically due to high NG prices is responsible for the drop in industrial demand, as can be seen from the chart, this trend has been in place since the late 1990s, when gas was still cheap. If I was a manufacturer in Toledo paying $17/hr why wouldnt I move my plant to Mexico and pay $4/hr for wages? It is unclear how much more demand destruction can come from the manufacturing sector. However, electricity demand and its use of natural gas has surely been growing.


THE NEW GODZILLA MOVIE - "GLOBAL WARMING VS GAS DEPLETION"


The past winter was the warmest on record. But just how warm is not commonly known. The dark red patches in North America in the below graph are 4-13 Degrees C above the historical average - needless to say, less people needed natural gas for heat (except in Russia - where they had the opposite trend in January)


Click to enlarge.
(Source - James Hansen NASA 2006)


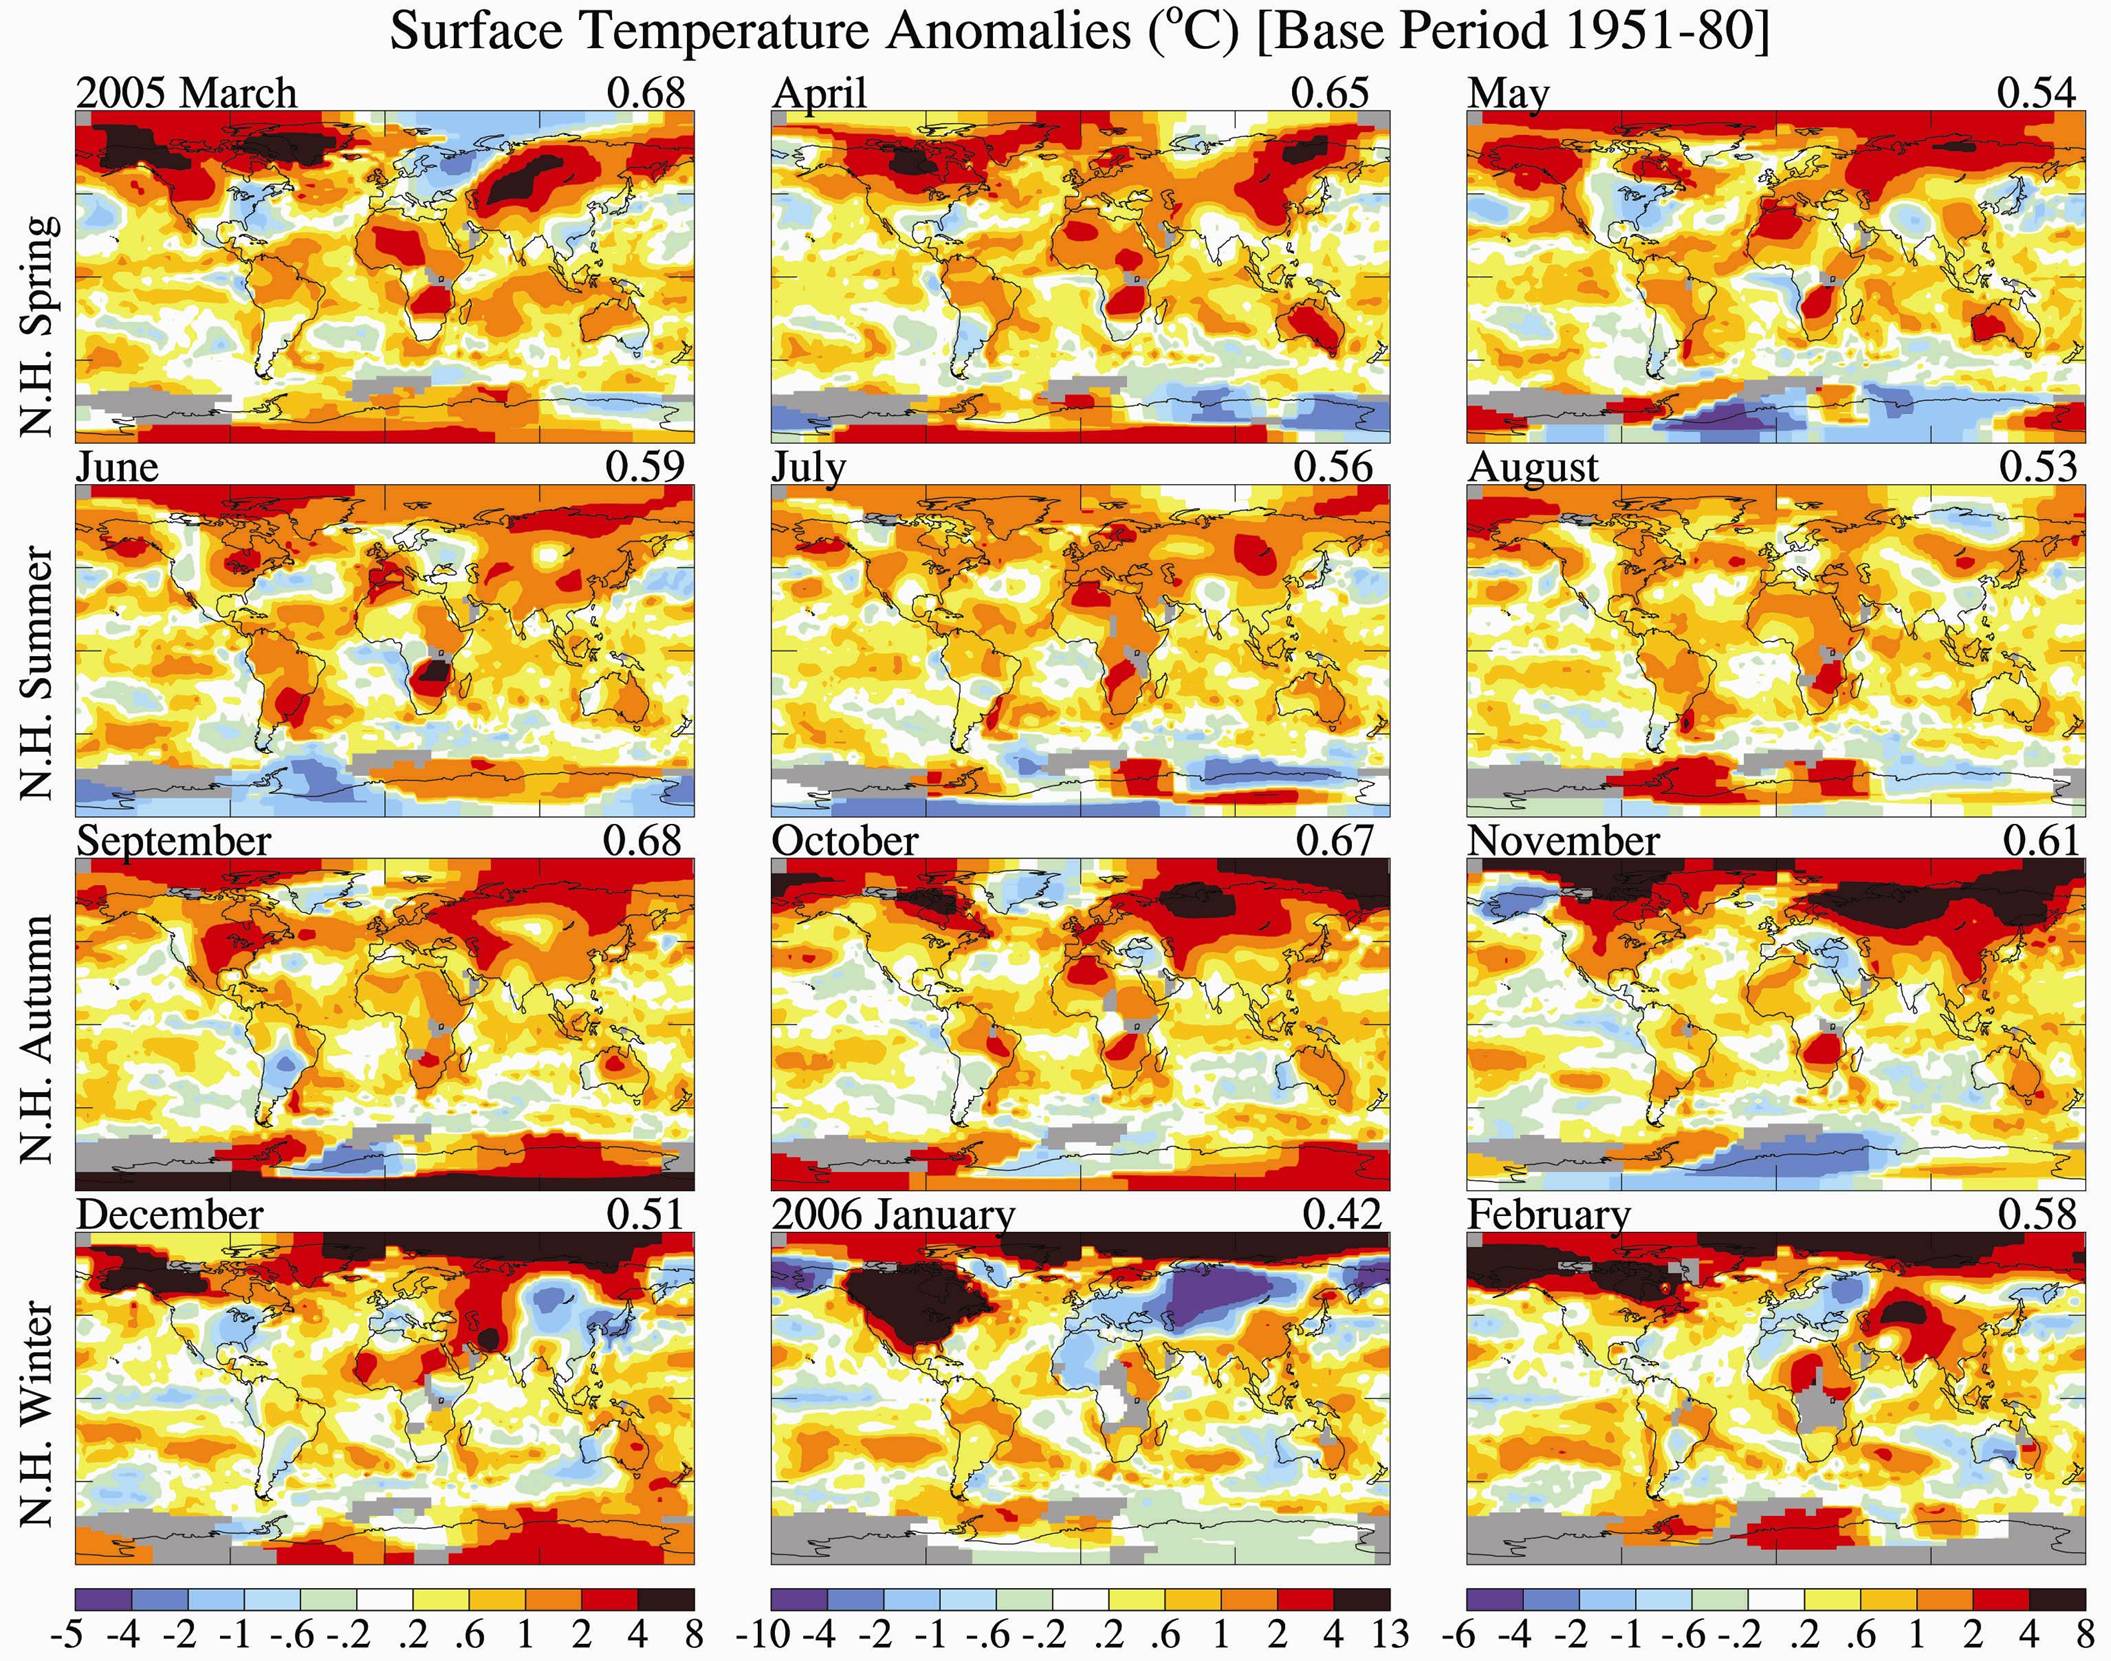
The warm temperatures contributed to much less demand for heating not only in the dead of winter, but in the spring as well. April, May and Jun 2006 each saw less natural gas usage than any equivalent month for the last 33 years. So far through 2 quarters in 2006, residential customers have used 12% less natural gas than 2005.


BACK TO THE FUTURE(S) - WHAT A DIFFERENCE A YEAR MAKES


Click to enlarge.


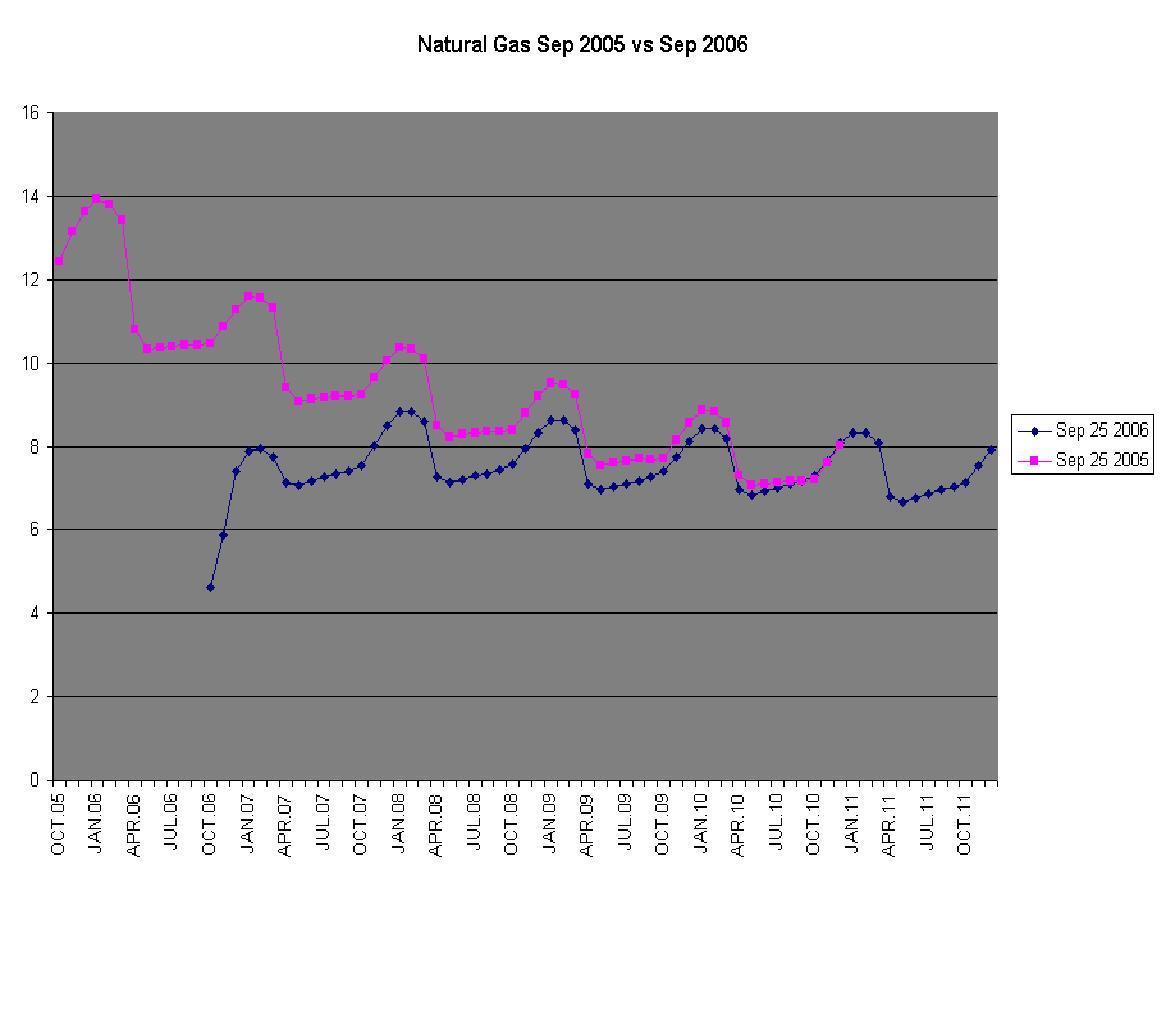
The pink line represents what the futures strip looked like in September 2005. The blue line represents the futures strip on Friday. (Notice, we are missing 12 months of pink line at the end because last year 60 months only brought us to 2010 and we are missing 12 months of blue line at the front because fridays futures are only looking forward, not backward)


What we see here is that the front month, which at one time was over $15 is now at around $4.50, an historic drop. However, a year or so out there has been a much smaller drop and at the end of the futures strip (2011) prices are actually slightly higher than they were a year ago. We also can see that winter months command higher prices, due to higher chances of shortages when natural gas usage is highest. Also, the shape of the winter 'hump', though at lower levels, is similar to a year ago. We also notice that currently all winters in the future are roughly priced the same, whereas a year ago, the nearer the winter, the higher the price.


WHAT A DIFFERENCE A MONTH MAKES


Click to enlarge.


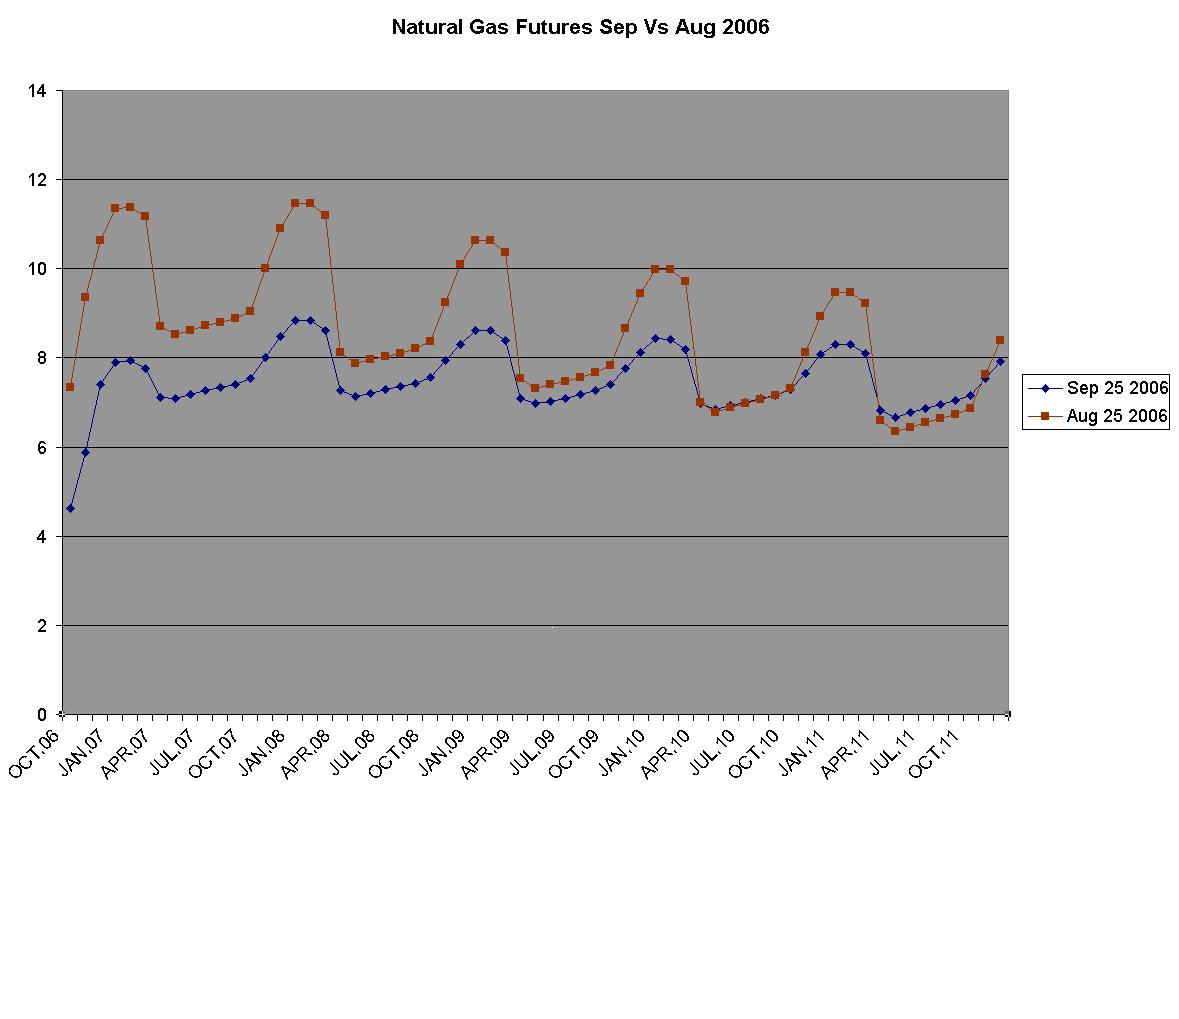
What does this graph tell us? First of all, near month futures have dropped like a stone since August - from near $8 to $4.50ish. Also, the winter-summer premium has declined, not only in this coming winter (where supposedly Amaranth had their calendar spreads), but in all subsequent winters. Either there was some major hedge fund activity, or some energy traders talked to Al Gore. Curiously, in the face of this steep decline, back dated futures actually went up (the blue is higher than the brown in 2011)


WHAT A DIFFERENCE A WEEK MAKES


Click to enlarge.


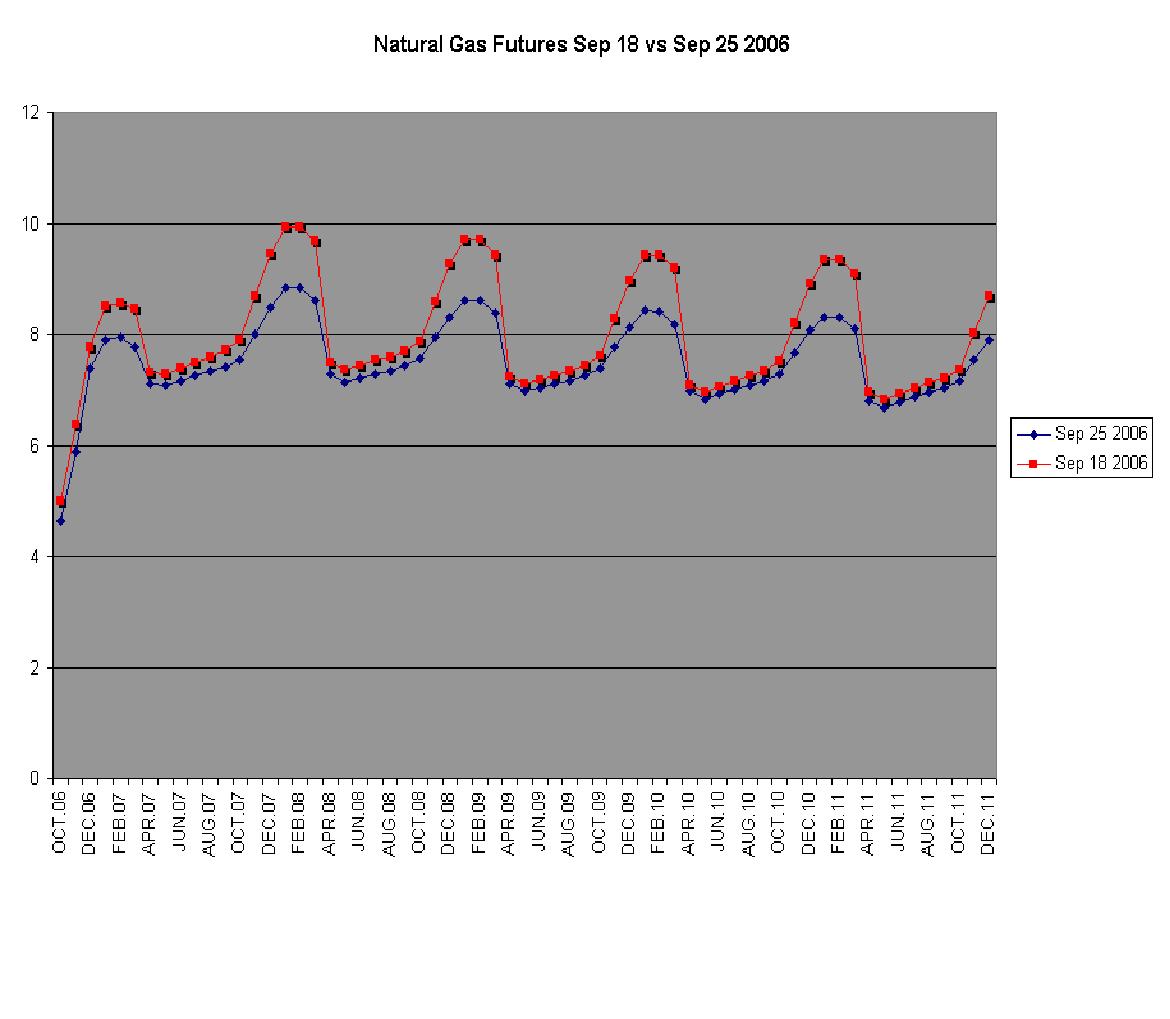
Here we can see that in all years except for 2006, the majority of the winter-summer premium collapse of the last month came in the last week. (compare the brown-blue vs red-blue in the two graphs). However, this winters price differential had already collapsed, presumably earlier in the month, from about a $2.50 premium over spring to about $1.


If we believe the media reports of Amaranth losing $6 billion, how could they do that in natural gas calendar spreads? First of all, each natural gas futures contract is 10,000 million BTUs or 10 million cubic feet of gas - this means for each 1 point movement in price, the contract value changes by $10,000. So to lose $6B, one would have to have on 400,000 contracts if there was a $1.50 loss. However, the entire open interest of all the 2006-7 winter months is about 260,000 contracts and the entire open interest of every contract thru 2011 is 960,000 contracts. So either Amaranth had off balance sheet exposure (derivatives), they had things other than calendar spreads on (the actual front month contract declined almost $4), or something else was afoot.


Incidentally, if they did have 400,000 contracts, that would represent 4 trillion cubic feet, or about 20% of US annual natural gas consumption. Boy do energy and dollars make strange bedfellows...


AND FOR SOME PERSPECTIVE


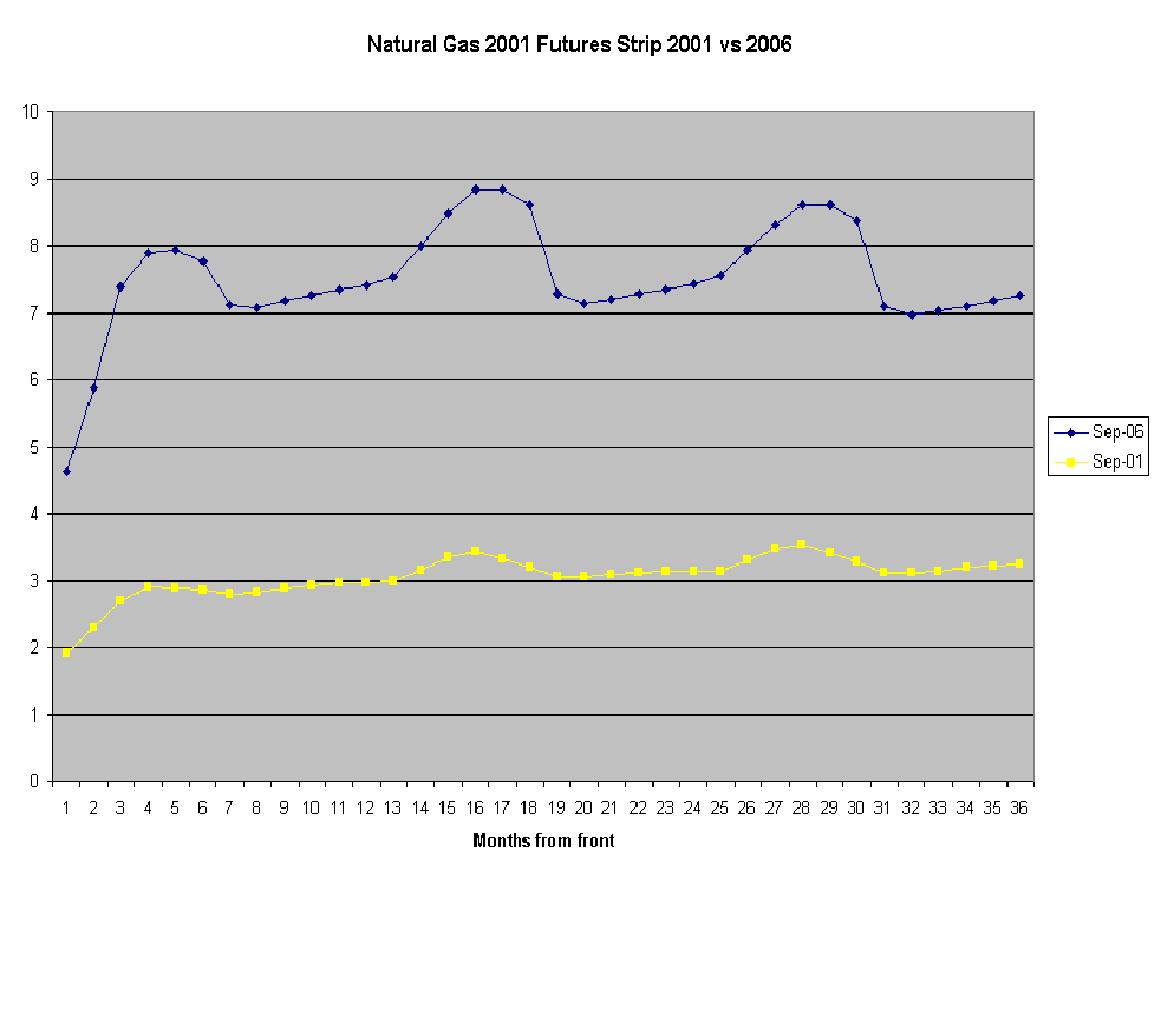
Keep in mind that despite the dramatic fall in natural gas prices in the past year, when we compare the current futures strip to what it looked like 5 years ago, we see a) current prices are still much higher that they used to be and b) the winter 'humps', though still existent 5 years ago, were much smaller.


Click to enlarge.


CONCLUSIONS


We currently have a glut of natural gas. As scary as the future supply situation is, the fact is that even with a cold winter supplies will be adequate. Could another warm winter (it is an el Nino year) combined with no increase in storage capacity result in actual flaring of gas? Producers wouldn't allow this to happen of course, as at SOME price they will shut-in production and stop drilling new wells. In fact, today Baker Hughes announced their new weekly rig count, and the Canadians, always quick to reduce drilling on commodity price drops, had a 22% drop in rigs from last week. High prices gave us demand destruction. Low prices give us supply destruction.


Low prices, while currently pleasant, send the wrong long term signal to the alternative energy markets (like wind, tidal, solar, etc). Energy price volatility (in both directions) interrupts progress being made replacing fossil fuels with renewables. Low natural gas prices remove the motivation of utility providers to invest in alternatives. Low prices also prevent wind and solar entrepreneurs from being cost competitive, until the signal is too late. Furthermore, continued volatility will hamstring policymakers. A warm winter and everything is fine and a cold winter and people freeze in Michigan. As James Schlesinger, our nations first energy secretary said about energy "We have only two modes--complacency and panic." I can think of a third mode -schizophrenia due to alternating years of complacency and panic.


Towards this end, and this applies to crude oil as well, the ease with which the wall street crowd can impact the price of a commodity that is so ubiquitous in making our system work, combined with growing knowledge that fossil fuels are a one time subsidy given to humanity and are depleting rapidly, should alert policymakers to the importance of making immediate changes to current energy policy. In addition to position limits for non-users or hedgers of energy, we should create a floor price for oil and gas, so that financial market-led volatility or intermittent gluts of product do not derail the development of alternative forms of electricity and liquid fuels. The achilles heel of the big two fossil fuels in their use in our world, is the time it takes to replace them. The natural gas market, in its current price dichotomy, is a prime example of the high standard deviation potential in our current system. Heads everything is rosy. Tails there are power outages.


I have no idea whether it will be cold this winter.


*Note - Thanks to Art Smith of John S Herold and Co., Joann Arena at the New York Mercantile Exchange, Neal Elliot at ACEEE, and John Rowan at Johnson Rice for data that was used in this post.

Monday, September 4, 2006

A Closer Look at Oil Futures

Fossil fuels comprise the largest commodity markets on the planet. In a world facing an upcoming date when it will have used 50% of its oil (and natural gas), interest in energy futures will continue to increase. And, as energy becomes more precious vis-à-vis dollars, the activity in the futures markets, particularly for crude oil and natural gas, will have increasing impacts on society. Indeed, the amount of finite oil that can be financially controlled by a near infinite amount of money is enormous. The following is a basic primer on energy futures and will be one of several foundational posts linked to a longer upcoming story, "Peak Oil, Investments, and Diversification". I will outline the basics of an oil futures contract, and discuss the risks and rewards of investing in energy futures. The post will conclude with a discussion of the growing paradox between money and energy.


[break]

There have been numerous posts on The Oil Drum referencing crude oil futures markets (Peak Oil Contango?, Predicting Future Oil Prices). If Peak Oil is factual (which I completely believe it to be), then at some point the mainstream public will gravitate towards investments that benefit from long term higher oil prices. Crude oil futures may not be the simplest but are the most direct way to invest in this theme(if dollars are your goal)


INVESTING IN FUTURES


Before we get to the specifics of an oil futures contract, lets explain exactly what a generic futures contract is, and how one invests/speculates in one.


First, the difference between investment, speculation and gambling should be mentioned. Investment is a long term allocation of funds to something with a (perceived) positive rate of return. Speculation usually refers to a short term investment with a (perceived) positive rate of return. Gambling is allocating capital to something with a zero-sum or negative expected return. To spend capital on something that gets you a negative return implies there are other reasons for the decision (primarily maladaptive) which is a subject for another post.


Here is an excellent introduction to futures and forwards. Essentially, when one buys a futures contract on an exchange, one is entering into a legally binding contract to control the financial upside (and downside) of a product at a certain price and time. Futures markets are attractive to many because they offer often uncorrelated returns to conventional stocks and bonds and because the margin requirements are very low compared to traditional equity markets. Many commodities require 5% or less initial margin to enter into a futures position. (Crude oil is currently 6.7% margin ($4,725) for contracts expiring in 2006 and 4.8% margin ($3,850) for contracts expiring 2007-2012). With 5% margin a 10% move (in the right direction) will result not in a 10% return but in a 200% return on money invested. (Leveraged return =(100/Margin rate) x Nominal return). Of course, this leverage is a double edged sword as a move in the wrong direction results in sharp losses and a move below maintenance margin will result in a call from the broker representing the clearinghouse. If subsequent margin is not posted on a losing position, the clearing member can legally liquidate the position without the investors permission. The vast majority of players in the futures markets never take delivery of the product, but participate in the financial movement of the commodity until they close out their contract prior to expiration.


So, after one buys (or sells) a futures contract, it will eventually result in one of three outcomes:

  1. the buyer will sell it at some point prior to expiration at a gain or a loss
  2. if a margin call occurs and the client doesn't post required margin, the brokerage firm will liquidate the position, irrespective of profit or loss.
  3. the contract will expire, and the buyer (seller) will take (make) delivery of the specified commodity.

CRUDE OIL FUTURES

(The grey box quotes are directly from the NYMEX website)

Crude oil is the world's most actively traded commodity, and the NYMEX Division light, sweet crude oil futures contract is the world's most liquid forum for crude oil trading, as well as the world's largest-volume futures contract trading on a physical commodity. Because of its excellent liquidity and price transparency, the contract is used as a principal international pricing benchmark.

The contract trades in units of 1,000 barrels, and the delivery point is Cushing, Oklahoma, which is also accessible to the international spot markets via pipelines. The contract provides for delivery of several grades of domestic and internationally traded foreign crudes, and serves the diverse needs of the physical market.

Light, sweet crudes are preferred by refiners because of their low sulfur content and relatively high yields of high-value products such as gasoline, diesel fuel, heating oil, and jet fuel.

Specific domestic crudes with 0.42% sulfur by weight or less, not less than 37° API gravity nor more than 42° API gravity. The following domestic crude streams are deliverable: West Texas Intermediate, Low Sweet Mix, New Mexican Sweet, North Texas Sweet, Oklahoma Sweet, South Texas Sweet.

Specific foreign crudes of not less than 34° API nor more than 42° API. The following foreign streams are deliverable: U.K. Brent and Forties, for which the seller shall receive a 30 cent per barrel discount below the final settlement price; Norwegian Oseberg Blend is delivered at a 55¢-per-barrel discount; Nigerian Bonny Light, Qua Iboe, and Colombian Cusiana are delivered at 15¢ premiums.

The contract is listed for 72 months.

As of Wednesday there was open interest of 1,130,596 contracts on the entire oil futures strip from Oct 2006 thru Dec 2012. At 1,000 barrels per contract this represents 1.1 billion barrels of notional oil, only about 12% of annual use for the US. (I admit a lack in html graphics ability, especially compared to The Oil Drum master)

As of this writing, front month oil is $69.19. The strip prices peak in Dec 2007 at $74.44 gradually declining to $66.30 in 2012.

INVESTING IN CRUDE OIL FUTURES

These are some of the more prominent reasons to invest in oil futures (in a Peak Oil world):

  1. Oil, unlike other futures choices, is actually embedded in ALL commodities. It doesn't take sugar to deliver cocoa or frozen orange juice to plant soybeans. The pervasivness and non-substitutability (easily) of oil will eventually result in outsized price increases
  2. The market does not recognize a)net energy, b)the important differences between (short term) flow and (long term) reserves or c)net exports. As these concepts permeate the investing public, it will result in new higher price floors.
  3. Oil price spikes will likely be negatively correlated, or at least uncorrelated with other asset classes, so provide beneficial diversification.
  4. All renewable sources of energy (wind, solar, biomass refining, etc) require oil to transport their goods and employees. Even if we seamlessly transition from a world of fossil fuels to one of renewables, we cant make windmills from wind or solar panels from sun. Oil will continue to increase in value.
  5. We still are firmly entrenched in a neo-classical system that believes in perfect substitutes so 'hoarding' behavior is not yet being seen. Hoarding could occur at local, regional and national levels and once the concept of finiteness of oil is more widely understood, the hoarding aspect will represent another permanent increase in demand.

These are some of the more prominent risks associated with oil futures (in a Peak Oil world):

  1. Since oil is priced at the marginal unit, demand destruction, even in the face of less future reserves, will result in price drops. Large exogenous shocks to the system, like bird flu or some other natural (or man-made) disaster could cause oil prices to drop precipitously.
  2. Since oil is only storable to a point by end-users, a situation like the one above would preclude end users (that are aware of long term scarcity issues) from `hoarding' at the margin and prices could stay low until the economy recovered.
  3. If oil prices go high enough, there is the risk of nationalization of the resources, rationing, windfall profits taxes on oil companies, all of which change the dynamics of the oil pricing market.
  4. In a real collapse (New Orleans on a national scale due to a shortfall in production below the level needed to make the system work), money in futures in a brokerage account might be meaningless.

LABOR AND ENERGY

Since it is Labor Day weekend, it might be instructive to remind ourselves how much `labor power' fossil fuels in general and crude oil in specific provide for us. Here are some quick facts about US oil consumption and production. A closer look shows the US currently uses about 7.6 billion barrels per year. Given our current population of 300,000,000, this equates to over 25 barrels per person per year. Each barrel of oil has 5,800,000 BTUs. An average man working for 1 hour generates between 240-500 BTUS (this range assumes computer operators blended with construction workers). So one barrel of oil provides the latent energy of up to 25,000 hours of human labor, or 12.5 years working 40 hour weeks.

Using this estimate (and this is unadjusted for energy 'quality', e.g. it would be hard to get enough persons to push a semi-truck full of steel from Chicago to Denver.) So annually each American has at its disposal 300+ high quality oil slaves (and that's just the oil -if we include the natural gas and coal we're up to 57 boe which is 700+ energy slaves). We are receiving a massive labor subsidy due to fossil fuels.

One barrel of oil costs $70 and generates the energy of 12.5 years of human work. The average American wage is about $20 per hour so a business can pay someone for 3.5 hours of work for the same amount of money. In effect, we are printing money to buy the good stuff from countries that haven't yet expended their `energy armies'. (How long the world will continue to accept an abstraction for something finite and powerful is an open question, but something here seems awry. I humbly opine that this paradox between energy, labor and value will necessitate that neoclassical economics be replaced by a better model.)

ENERGY AND POPULATION

I believe there are 3 different definitions of Peak Oil and they will come in succession.

  1. The point when we have used half of the oil that will ever be extracted.
  2. The point when we reach maximum sustained production (given that we use high technology like horizontal drilling and water and nitrogen injection, we are likely borrowing from the second half of what was normally a bell shaped curve so this point will come later).
  3. The point when the meme of finite energy resources takes hold in society.
For sake of this discussion, lets use the first definition, and assume we are roughly at Peak Oil now. We have used 1 trillion + barrels and have 1 trillion + left. But as discussed previously (exhaustively?), those 1 trillion barrels require a decent amount of energy to locate, harvest, refine, and distribute and this amount of `energy cost' subtracted from the gross is increasing.

Lets assume that the 1 trillion barrels nets out to 650 billion barrels to non-energy society. (Yes I chose this number specifically). Given our current world population, that equates to 100 barrels of net oil remaining for every person on the planet, (and leaves none for our children, grandchildren or subsequent generations). Any Tom, Dick or Rainwater for $4,000 can financially control 1000 barrels of oil in the futures markets, or 10 times his or her all time planetary allotment. Once Peak Oil version #3 is realized, there will be many investors clamoring to financially (or physically) control their 100 barrels, let alone 10,000 or 1,000,000 barrels. Can the futures markets absorb this? Will this make the Hunt Brothers cornering of the silver market seem like childsplay? The world uses 85 million barrels per day - and for a mere $340 million in margin, this entire amount can be controlled via the futures markets. Consider this in contrast to the $7+ Trillion invested or saved annually, and the nearly $100 trillion in stock and bond market assets. Will the market send the right signals? What smart angles will hedge funds take on this?

CONCLUDING THOUGHTS

Global society runs on a just-in-time inventory system. It cares about the current flow of products and assumes that shortages will trigger price increases which will in turn spur development of substitute products. Paradoxically, an awareness of future oil scarcity coupled with higher current flows would result in lower prices. Imagine if OPEC issued a press release that admitted their proven reserves were overstated but simultaneously announced that they had developed a new siphoning technology that would immediately bring 120 million barrels per day online. Would futures go up or down?? They would plummet as there would be more supply at the margin than people could use or store. Similarly, if OPEC announced a new trillion barrel oil find, but simultaneously initiated a reduction of the current flow rate to 50 million bpd, oil prices would spike even in the face of long term abundance.

What if Exxon announced they believed oil was going to $200+ per barrel and therefore had adopted a policy to shut down production and lay off workers so as to keep the oil in the ground until 2020 when it will be worth more? Their market capitalization would be decimated, as investors care about current quarterly and yearly earnings, which would now be near zero.

The market cares about the marginal barrel and immediate results. And that fact, in the opinion of this writer, is the achilles heel of modern society. Oil and natural gas are products that are largely non-discretionary in our world economy. They are unlike any other product in history in the % of human society that revolves around them. Long lead times are needed to create alternatives and restructure society around more local energy sources and smaller energy footprints. The high futures prices caused by production shortages or excessive financial ingress into commodities will slow economic activity, which will then reduce demand for oil and prices will plummet and overshoot on the downside. Then, when the economy next recovers, we will be further along the curve of depletion and prices will make new highs. This cycle of volatility will hamstring policymakers (and investors) as we will get mixed signals every 12-18 months until we are well past Peak when we will have permanently high oil prices.

The invisible hand moves from mouth to feed trough and back again, like a machine. Without market regulation, the hand will gorge its corpulent body, unaware that the upstream feedtrough appears to be narrowing. True to its origins, it will only react when its hungry, and as the Hirsch/Bezdek report pointed out, society needs 10-20 years to effectively prepare for a change in diet.

In conclusion, many are saying that the era of cheap energy is over but in the ways that count it is still here. At some point in the future, when net tradable global production is too small to quench societies thirst, $70 oil and $3 gasoline will be viewed as incredibly cheap.