Sunday, July 29, 2007

The Implication of Biofuel Production for US Water Supplies

In addressing the supply side of oil and gas depletion, much hope has been put into the scaling of 'biofuels', by applying new (and old) technologies to annual crops to create ethanol or biodiesel, thus providing chemically viable alternatives to the transportation liquids derived from crude oil. Much of the biofuels debate thus far has focused on their lower energy balance, vis-a-vis crude oil. While this is important, analysis of the impacts on non-energy inputs and impacts should a massive scaling of biofuels occur, urgently needs to be discussed. The National Academy of Sciences recently published a report titled "Water Implications of Biofuel Production in the United States". The paper outlines impacts and limitations on both water availability and water quality that would follow the pursuit of a national strategy to replace liquid fossil fuels with those made from biomass.


Existing and planned ethanol facilities (2007) and their estimated total water use mapped
with the principal bedrock aquifers of the United States and total water use in year 2000.(Source USGS) Click to enlarge.


[break]

Some long time readers of theoildrum.com think we have beaten the corn ethanol horse to death. While this may appear true to certain camps (especially ethanol stock investors!), the fact remains that corn ethanol technology is still at the forefront of our nations mitigation responses to 'energy security' and Peak Oil. Production is slated to increase from 5 billion gallons last year to 35 billion gallons in a decade. The DOE projects that biofuels can provide us with 30% of our liquid fuel needs by 2030. However, given that we have limited amounts of high quality resources: crude oil, gasoline, fresh water, breathable air, healthy soil, productive ecosystems, etc., one of the highest policy priorities (in conjunction with attempts to change our conspicuous consumption paradigm) should be to establish the best use of these scarce resources to secure future energy flows. Two of the most precious of these are energy and water, and are the subject of todays post.

This post is a summary of an excellent recent report commissioned by the Natural Resource Council via the National Academy of Sciences, titled "The Implications of Biofuel Production for United States Water Supplies" It can be purchased in book form or downloaded as a pdf here. (Editors note: As I've discussed here recently, two University of Vermont colleagues and I have written a related paper highlighting the critical and limiting role that water will play in future energy production, particularly from bioenergy. "Burning Water - EROWI - The Energy Return on Water Invested", is currently (still) in the review/rejection/resubmittal process so I've been unable to post it here, even though it was written over a year ago). Since corn ethanol looks to still be a key policy issue in the upcoming Presidential primaries in Iowa, I thought a brief overview of this important NAS paper would be informative to our readers. The grey boxes and graphs are from the paper, "Water Implications of Biofuel Production in the United States", interweaved throughout the authors summary. The 'bottom line' and graphic at the end, are my own.


The Implications of Biofuel Production for United States Water Supplies


These were the scientists that oversaw/wrote the report:


COMMITTEE ON WATER IMPLICATIONS OF BIOFUELS PRODUCTION IN THE UNITED STATES

JERALD L. SCHNOOR, Chair, University of Iowa, Iowa City
OTTO C. DOERING III, Purdue University, West Lafayette, Indiana
DARA ENTEKHABI, Massachusetts Institute of Technology, Cambridge
EDWARD A. HILER, Texas A&M University, College Station
THEODORE L. HULLAR, Cornell University, Ithaca, New York
G. DAVID TILMAN, University of Minnesota, St. Paul


ABOUT BIOMASS, BIOFUELS AND WATER


Because of a strong U.S. national interest in greater energy independence, biofuels have become important liquid transportation fuels and are likely to remain so for the foreseeable future. Currently, the main biofuel in the United States is ethanol derived from corn kernels, with a very small fraction made from sorghum. Biodiesel from soybeans also comprises a small fraction of U.S. biofuels. Ethanol from “cellulosic” plant sources (such as corn stalks and wheat straw, native grasses, and forest trimmings) is expected to begin commercially within the next decade.


US Production of Biofuels from Various Feedstocks 2006 Click to enlarge.


Recent increases in oil prices in conjunction with subsidy policies have led to a dramatic expansion in corn ethanol production and high interest in further expansion over the next decade. President Bush has called for production of 35 billion gallons of ethanol annually by 2017, which, if achieved, would comprise about 15 percent of U.S. liquid transportation fuels. This goal is almost certain to result in a major increase in corn production, at least until marketable future alternatives are developed.

Among the possible challenges to biofuel development that may not have received appropriate attention are its effects on water and related land resources. The central questions are how water use and water quality are expected to change as the U.S. agricultural portfolio shifts to include more energy crops and as overall agricultural production potentially increases. Such questions need to be considered within the context of U.S. policy and also the expected advances in technology and agricultural practices that could help reduce water impacts.

To help illuminate these issues, the Water Science and Technology Board (WSTB) of the National Research Council held a colloquium on “Water Implications of Biofuels Production in the United States” in Washington, D.C., on July 12, 2007, which was attended by more than 130 people from federal and state government, non-governmental organizations, academia, and industry. WSTB established a committee to organize and host the colloquium and to develop this report (see Box 1-1). This report draws some conclusions about the water implications of biofuels productions based on discussions at the colloquium, written submissions of participants, the peer-reviewed literature, and the best professional judgments of the committee.

Water is an increasingly precious resource used for many purposes including drinking and other municipal uses, hydropower, cooling thermoelectric plants, manufacturing, recreation, habitat for fish and wildlife, and agriculture. The ways in which a shift to growing more energy crops will affect the availability and quality of water is a complex issue that is difficult to monitor and will vary greatly by region.

In some areas of the country, water resources already are significantly stressed. For example, large portions of the Ogallala (or High Plains) aquifer, which extends from west Texas up into South Dakota and Wyoming, show water table declines of over 100 feet. Deterioration in water quality may further reduce available supplies. Increased biofuels production adds pressure to the water management challenges the nation already faces.

Some of the water needed to grow biofuel crops will come from rainfall, but the rest will come from irrigation from groundwater or surface water sources. The primary concern with regard to water availability is how much irrigation will be required—either new or reallocated— that might compete with water used for other purposes. Irrigation accounts for the majority of the nation’s “consumptive use” of water—that is the water lost through evaporation and through plant leaves that does not become available for reuse.


FIGURE 1-1 The agricultural water cycle. Inputs to a crop include rainfall and irrigation from surface
water and groundwater. Some water is “consumed” (that is, incorporated in the crop or evapotranspired),
some returns to surface waterbodies for human or ecological use downstream, and some infiltrates into
the ground. Click to enlarge.


Figure 1-1 makes it clear that crop water may originate from one source, such as rain or groundwater, and be discharged to another, such as surface water. Precipitation, groundwater, and surface water sources—and groundwater and surface water discharges—are not only viewed differently in water law and policy, but also have different consequences for long-term sustainable use of the resource base. Since groundwater accounts for almost all of the long-term storage of water on the continents, extracting groundwater for irrigation that is subsequently discharged to streams may decrease the water available for future users of the aquifer.


The question of whether more or less water will be applied to biofuel crops depends on what crop is being substituted and where it is being grown. For example, in much of the country, the crop substitution to produce biofuel will be from soybeans to corn. Corn generally uses less water than soybeans and cotton in the Pacific and Mountain regions, but the reverse is true in the Northern and Southern Plains, and the crops use about the same amount of water in the North Central and Eastern regions.


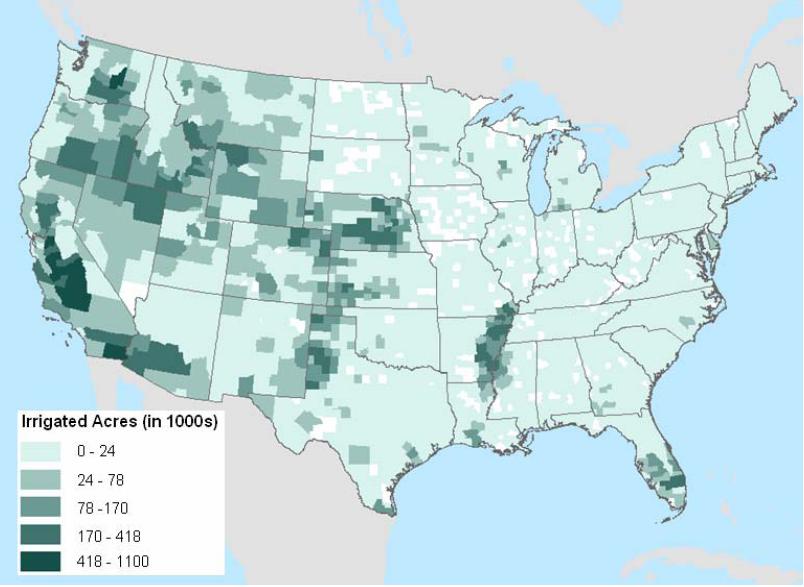
FIGURE 1-2 Irrigated land in the United States. Note that most of this is located in the more arid regions
of the country. SOURCE: N. Gollehon, USDA ERS, written commun., July 12, 2007. Based on data
from U.S. Department of Agriculture (USDA) Economic Research Service (ERS) Census of Agriculture.. Click to enlarge.


Understanding water quantity impacts is dependent on understanding the agricultural water cycle depicted in Figure 1-1. Crops can be either rainfed or irrigated (see Figure 1-2). Irrigation water can come from groundwater or surface water, and groundwater can be withdrawn from either a surficial aquifer (connected directly to the surface) or a confined aquifer (overlain by a low permeability layer, or aquitard, such as clay). Some of the applied water is incorporated into the crop, but most of it leaves the fields as (1) evaporation from the soil and transpiration from plants (called evapotranspiration or ET), (2) runoff to rivers and streams (sometimes called “return flow”), and (3) infiltration to the surficial aquifer. The water that is incorporated into the crops or lost to evapotranspiration is referred to as “consumptive use,” because it cannot be reused for another purpose in the immediate vicinity. Rates of ET vary greatly by the type of crop. During a growing season, a leaf will transpire many times more water than its own weight. An acre of corn gives off about 3,000- 4,000 gallons of water each day while a large oak tree can transpire 40,000 gallons per year (USGS, 2007). Grasses that might be in cellulosic production have a slightly higher ET rate than corn, but considerably a lower ET rate than trees.


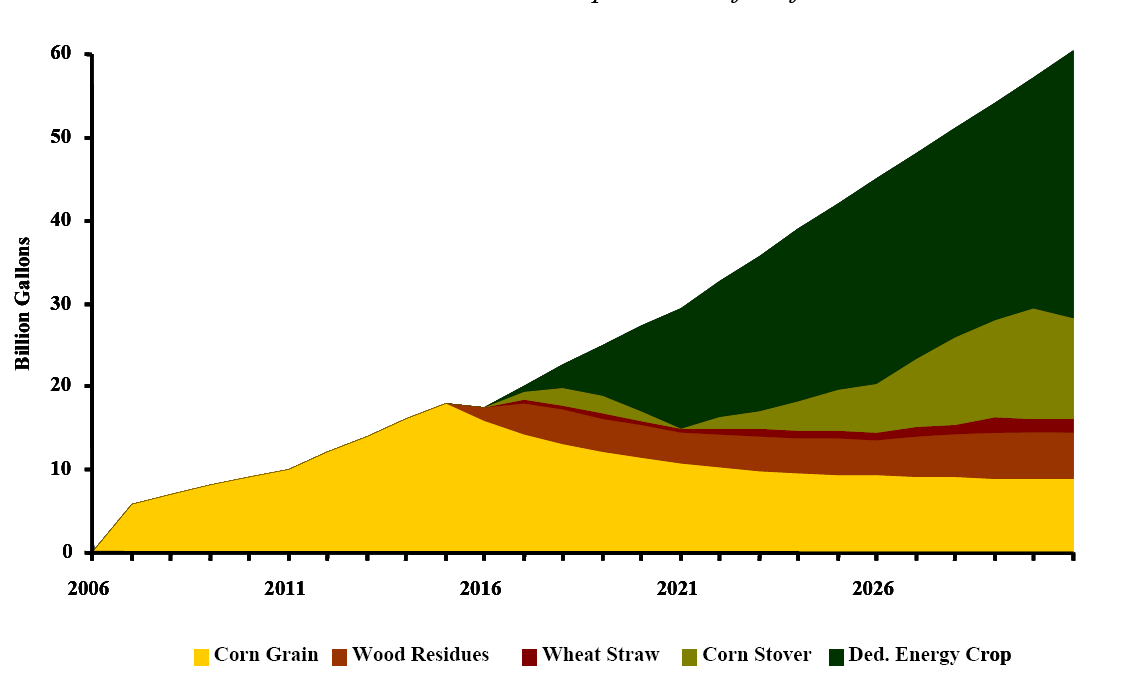
Projection of ethanol production by feedstock assuming cellulose-to-ethanol production
begins in 2015. Dedicated energy crops refer to those grown solely for energy production.
SOURCE: D. Ugarte, University of Tennessee Click to enlarge.


Distribution of the production of cellulosic materials in dry tons by the year 2030.
SOURCE: D. Ugarte, University of Tennessee Click to enlarge.


There are many uncertainties in estimating consumptive water use of the biofuel feedstocks of the future. Water data are less available for some of the proposed cellulosic feedstocks—for example, native grasses on marginal lands—than for widespread and common crops such as corn, soybeans, sorghum, and others. Neither the current consumptive water use of the marginal lands nor the potential water demand of the native grasses is well known. Further, while irrigation of native grass today would be unusual, this could easily change as production of cellulosic ethanol gets underway.

CROP WATER AVAILABILITY AND USE


FIGURE 2-1 Regional irrigation water application for various crops for six regions of the United States.
Irrigation application is normalized by area, and is in feet. SOURCE: N. Gollehon, U.S. Department of
Agriculture (USDA) Economic Research Service (ERS), written commun., July 12, 2007. Based on data
from USDA Census of Agriculture.Click to enlarge.


Shifting land from an existing crop (or noncrop plant species) to a crop used in biofuel production has the potential to change irrigation water use, and thus the local water availability. Conversion to the different type of biomass will result in increased water use in some cases, in other cases a decrease. As an example, in much of the country, the crop substitution is from soy to corn. The regional effects of this can be seen in Figure 2-1. Corn generally uses less water than soybeansand cotton in the Pacific and Mountain regions. The reverse is true in the Northern and Southern Plains, and the crops use about the same amount of water in the North Central and Eastern regions. Changes in agricultural water use would generally parallel these trends. Another example is in Northern Texas, where annual evapotranspiration (ET) rates per year for alfalfa, corn, cotton, and sorghum are estimated to be about 1,600, 760, 640, and 580 mm (63, 30, 25, and 23 inches), respectively. Therefore, regional water loss to ET will likely decrease if alfalfa acreage is converted to corn, but increase if cotton or sorghum is converted.


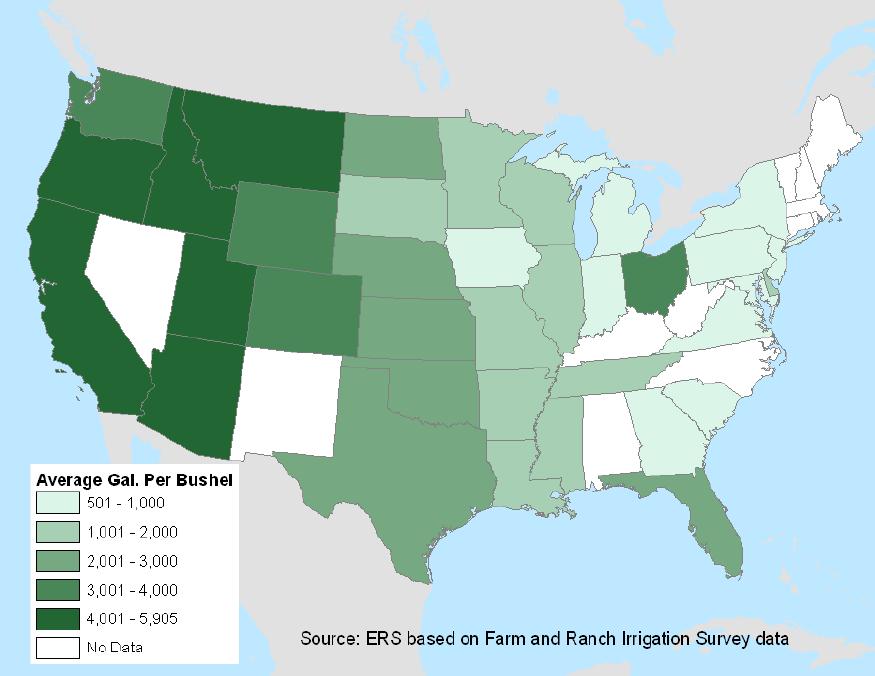
FIGURE 2-2 State-by-state water requirements in 2003 of irrigated corn (gallons of irrigation water per
bushel). SOURCE: N. Gollehon, USDA ERS, Based on data from
2003 Farm and Ranch Irrigation Survey (USDA, 2003).
Click to enlarge.


Given the regional differences in rainfall and groundwater storage, the feasibility and sustainability of biofuel crop production as a function of water availability may vary significantly by region. Figure 2-2 shows the state-by-state water requirement of irrigated corn in the continental United States. It demonstrates that the amount of rainfall and other hydroclimate conditions in a given area causes significant (10-fold) variations in the water requirement for the same crop. Clearly there will be geographic limits on certain kinds of biofuels feedstock simply based on their water requirements.


In the next 5 to 10 years, increased agricultural production for biofuels will probably not alter the national-aggregate view of water use. However, there are likely to be significant regional and local impacts where water resources are already stressed.

Water Quality Impacts


FIGURE 3-1. Comparison of fertilizer (top) and pesticide (bottom) application rates for corn, soybean,
and low-input high-diversity (LIHD; “biomass” in the figure) mixtures of native grassland perennials.
Fertilizer and pesticide application rates are U.S. averages. SOURCE: Tilman et al. (2006).
Click to enlarge.


Biomass feedstocks such as corn grain, soybeans, and mixed-species grassland biomass differ in current or proposed application rates of fertilizers and of pesticides. Of these three potential feedstocks, the greatest application rates of both fertilizer and pesticides per hectare are for corn (Figure 3-1). Phosphorus application rates are somewhat lower for soybeans than for corn. Nitrogen application rates are much lower for soybeans than for corn because soybeans, which are legumes, fix their own nitrogen from the atmosphere. Pesticide application rates for soybean are about half those for corn. The native grasses compare highly favorably to corn and soy for both fertilizers and pesticides, with order-of-magnitude lower application rates.


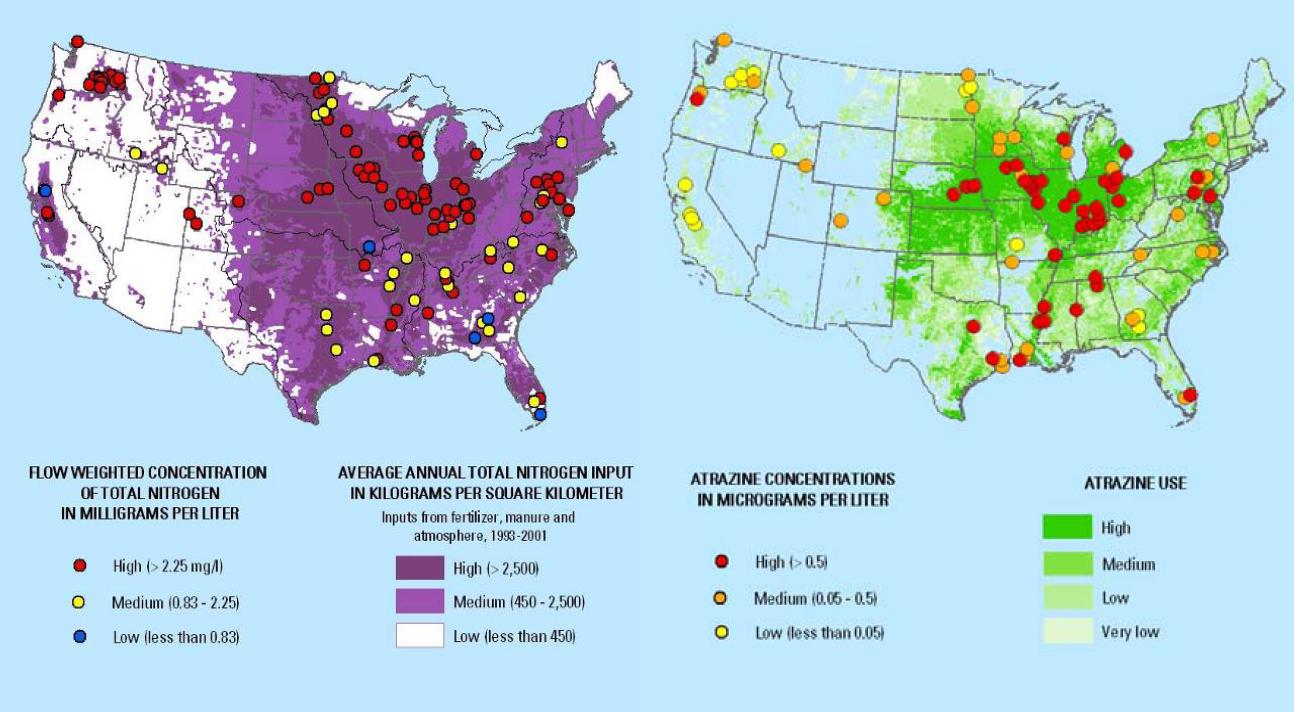
FIGURE 3-2 (left) N fertilization rates and stream concentrations of nitrate. (right) Atrazine
application rates and stream concentrations of atrazine. FIGURE SOURCE: J. Ward, U.S.
Geological Survey.
Click to enlarge.


The impacts of these differences in inputs can be visualized nationally by comparing N inputs (such as fertilizer and manure) and the concentrations of nitrate in stream water (Figure 3-2, left). There are similar patterns for stream concentrations of atrazine, a major herbicide used in corn cultivation (Figure 3-2, right), although the environmental effects of pesticides in current use are difficult to decipher. Both of these maps show that regionally the highest stream concentrations occur where the rates of application are highest, and that these rates are highest in the U.S. “Corn Belt.”


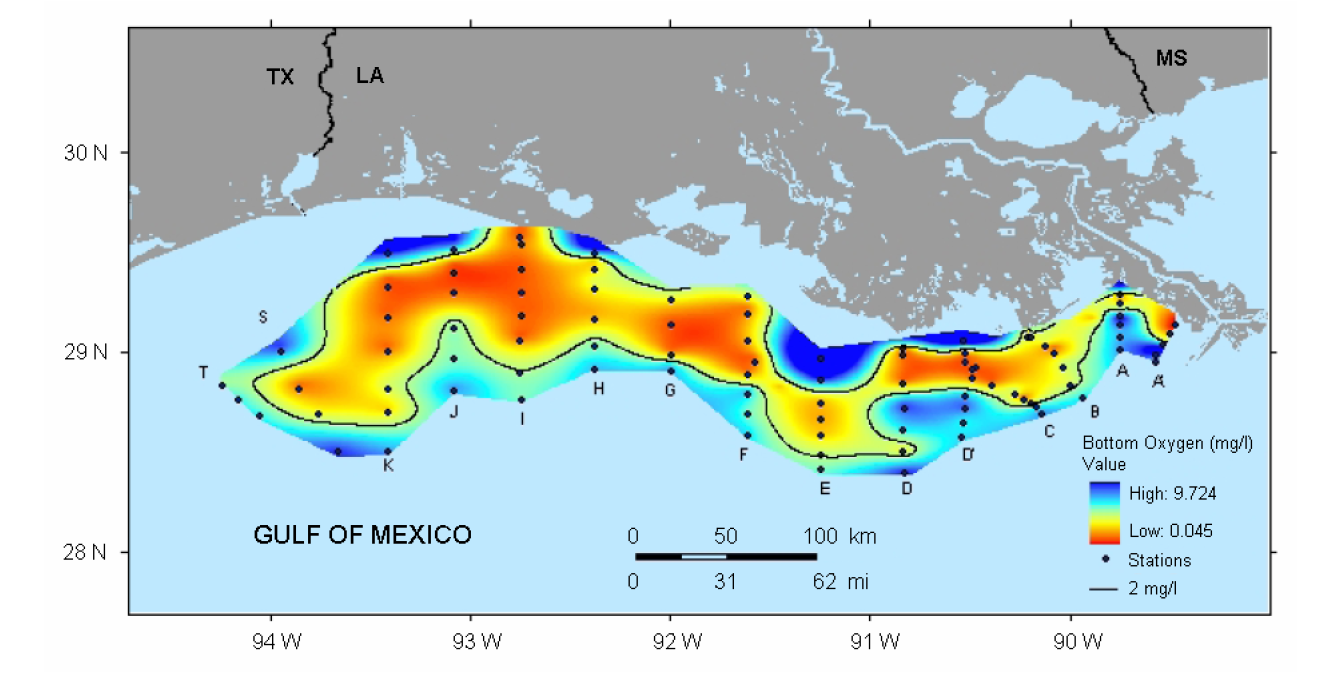
FIGURE 3-3 Dissolved oxygen contours (in milligrams per liter) in the Gulf of Mexico, July 21-28,
2007. SOURCE: Slightly modified from http://www.gulfhypoxia.net/shelfwide07/PressRelease07.pdf.

Click to enlarge.


The effects of biomass production on the nation’s coastal and offshore waters may be considerable. Nitrogen in the Mississippi River system is known to be the major cause of an oxygen-starved “dead zone” in the Gulf of Mexico (Figure 3-3), which in 2007 was the third largest ever mapped (http://www.gulfhypoxia.net). The condition known as hypoxia (low dissolved oxygen) occurs because elevated N (and, to a lesser extent, P) loading into the Gulf leads to algal blooms over a large area. Upon the death of these algae, they fall to the bottom and their decomposition consumes nearly all of the oxygen in the bottom water. This is lethal for most fish and other species that live there.


FIGURE 3-5 Environmental effects from the complete production and combustion lifecycles of corn
grain ethanol and soybean biodiesel. The figure shows the application of both (a) fertilizers and (b) and
pesticides, per unit of net energy gained from biofuel production. SOURCE: Hill et al., 2006
Click to enlarge.


There are many possible metrics, but an index that builds on the work shown in Figure 3-1 is inputs of fertilizers and pesticides per unit of the net energy gain captured in a biofuel. To estimate this first requires calculation of a biofuel’s net energy balance (NEB), that is, the energy content of the biofuel divided by the total fossil energy used throughout the full lifecycle of the production of the feedstock, its conversion to biofuel, and transport. U.S. corn ethanol is most commonly estimated to have a NEB of 1.25 to 1.3, that is, to return about 25-30 percent more energy, as ethanol, than the total fossil energy used throughout its production lifecycle. The NEB estimated for U.S. soybean biodiesel is about 1.8 to 2.0, or about a 100 percent net energy gain. Switchgrass ethanol via fermentation is projected to be much higher—between 4 and 15. Similarly high are the estimates for (a) cellulosic ethanol and (b) synthetic gasoline and diesel from certain mixtures of perennial prairie grasses, forbs, and legumes (NEB=5.5 and 8.1, respectively). Per unit of energy gained, corn ethanol and soybean biodiesel have dramatically different impacts on water quality. When fertilizer and pesticide application rates (Figure 3-1) are scaled relative to the NEB values of these two biofuels, they are seen to differ dramatically (Figure 3-5). Per unit of energy gained, biodiesel requires just 2 percent of the N and 8 percent of the P needed for corn ethanol. Pesticide use per NEB differs similarly. Low input high-diversity prairie biomass and other native species would also compare favorably relative to corn using this metric. This is just one possible metric of biofuels’ impact on water quality. Other measures might incorporate land requirements per unit of biofuel, soil erosion, or impacts of the associated biorefinery


Fertilizers applied to increase agriculture yields can result in excess nutrients (nitrogen [N] and to a lesser extent, phosphorous [P]) flowing into waterways via surface runoff and infiltration to groundwater. Nutrient pollution can have significant impacts on water quality. Excess nitrogen in the Mississippi River system is known to be a major cause of the oxygen starved “dead zone” in the Gulf of Mexico, in which many forms of marine life cannot survive. The Chesapeake Bay and other coastal waterbodies also suffer from hypoxia (low dissolved oxygen levels) caused by nutrient pollution. Over the past 40 years, the volume of the Chesapeake Bay’s hypoxic zone has more than tripled. Many inland lakes also are oxygen starved, more typically due to excess levels of phosphorous.

Corn, soybeans, and other biomass feedstocks differ in current or proposed rates of application of fertilizers and pesticides. One metric that can be used to compare water quality impacts of various crops are the inputs of fertilizers and pesticides per unit of the net energy gain captured in a biofuel. Of the potential feedstocks, the greatest application rates of both fertilizer and pesticides per hectare are for corn. Per unit of energy gained, biodiesel requires just 2 percent of the N and 8 percent of the P needed for corn ethanol. Pesticide use differs similarly. Low-input, high-diversity prairie biomass and other native species would also compare favorably relative to corn using this metric.

Another concern with regard to water quality is soil erosion from the tillage of crops. Soil erosion moves both sediments and agricultural pollutants into waterways. There are various farming methods that can help reduce soil erosion. However, if biofuel production increases overall agricultural production, especially on marginal lands that are more prone to soil erosion, erosion problems could increase. An exception would be native grasses such as switchgrass, which can reduce erosion on marginal lands.

All else being equal, the conversion of other crops or non-crop plants to corn will likely lead to much higher application rates of N, which could increase the severity of the nutrient pollution in the Gulf of Mexico and other waterways. However, it should be noted that recent advances in biotechnology have increased grain yields of corn per unit of applied N and P.


REDUCING WATER IMPACT THROUGH AGRICULTURAL PRACTICES


There are many agricultural practices and technologies that, if employed, can increase yield while reducing the impact of crops on water resources. Many of these technologies have already been developed and applied to various crops, especially corn, and they could be applied to cellulosic feedstocks. Technologies include a variety of water-conserving irrigation techniques, soil erosion prevention techniques, fertilizer efficiency techniques, and precision agriculture tools that take into account site-specific soil pH (acidity, alkalinity), soil moisture, soil depth, and other measures. Best Management Practices (BMPs) are a set of established methods that can be employed to reduce the negative environmental impacts of farming. Such practices can make a large, positive environmental impact. For example, in 1985, incentives were put in place to encourage adoption of conservation tillage practices. According to data from the National Resources Inventory (NRI), maintained by the Natural Resources Conservation Service, overall annual cropland erosion fell from 3.06 billion tons in 1982 to about 1.75 billion tons in 2003, a reduction of over 40 percent (http://www.nrcs.usda.gov/TECHNICAL/NRI/).

In addition, biotechnologies are being pursued that optimize grain production when the grain is used for biofuel. These technologies could help reduce water impacts by significantly increasing the plants’ efficiency in using nitrogen, drought and water-logging tolerance, and other desirable characteristics.

WATER IMPACTS OF BIOREFINERIES


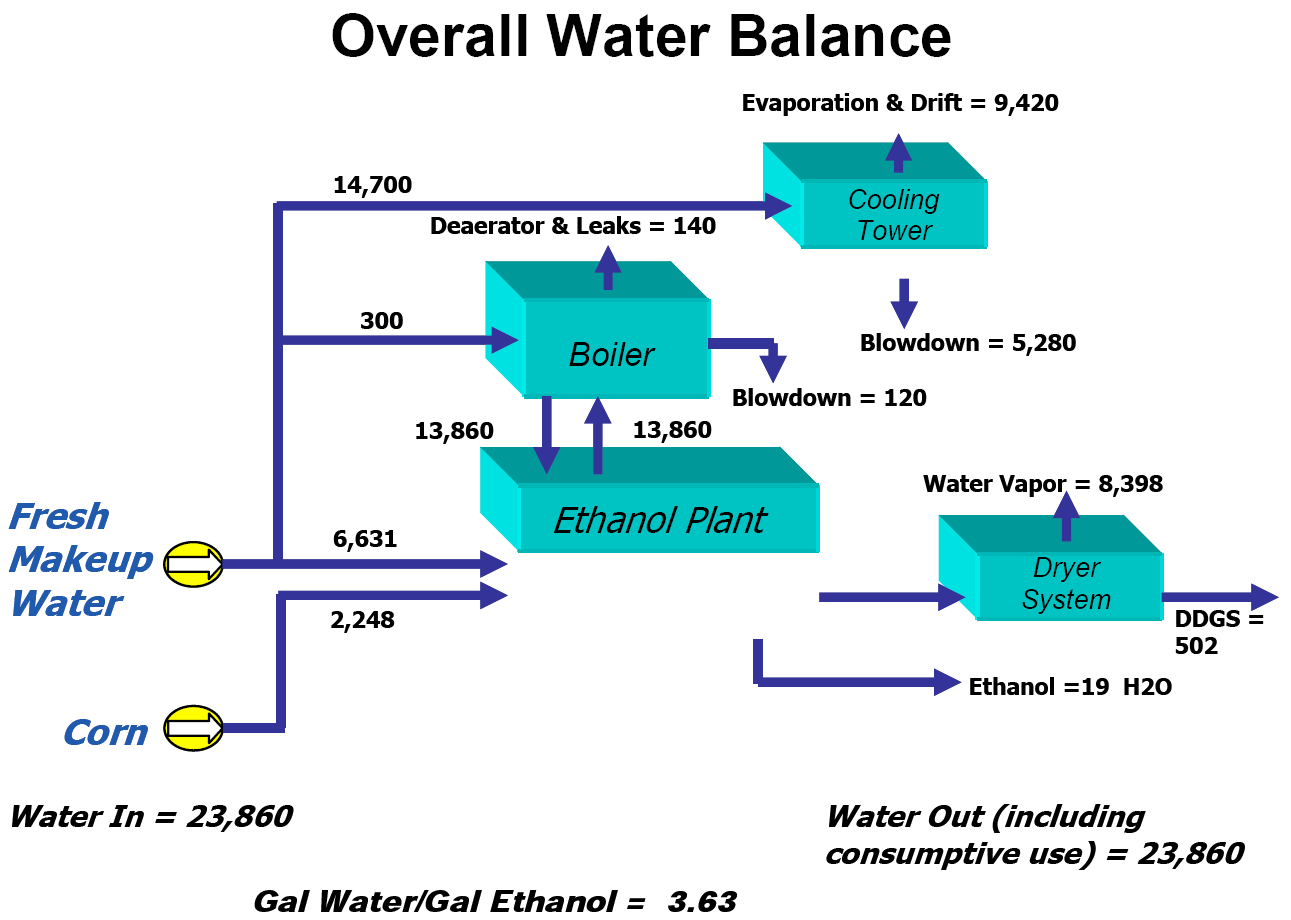
FIGURE 5-2 The overall water balance of a typical 50 million gallon per year corn-based Dry Mill
ethanol production facility. All figures are in gallons per hour. SOURCE: Courtesy of Delta-T Corp.
Click to enlarge.


Assuming the common figure of about 2.7 gallons of ethanol from one bushel of corn, 2,100 gallons of water/bushel * 1 bushel/2.7 gallon of ethanol = about 780 gallons of water per gallon of ethanol. (Additionally), current estimates of the consumptive water use from biorefinery facilities are in the range of 4 gallons of water per gallon of ethanol produced (gal/gal) (Pate et al., 2007). For perspective, consumptive water use in petroleum refining is about 1.5 gal/gal. Overall water use in biorefineries may be as high as 7 gal/gal, but this number has been consistently decreasing over time and as of 2005 was only slightly over 4 gal/gal in 2005. Thus for a 100 million gallon per year plant, a little over 400 million gallons of water per year would be withdrawn from aquifers or surface water sources (1.1 million gallons per day). The total water requirements for ethanol from cellulose are thought to be large—about 9.5 gal/gal, but this likely will decline as efficiency increases with experience at cellulosic-ethanol plants.


Existing and planned ethanol facilities (2007) and their estimated total water use mapped
with the principal bedrock aquifers of the United States and total water use in year 2000. Click to enlarge.


Siting of some ethanol plants is occurring where the water resource is already under duress. Figure 5-3 shows, for example, that many bioethanol plants that each require 0.1-1.0 million gallons per day are located on the High Plains aquifer. This aquifer is currently being pumped at a rate of more than 1.5 billion gallons per day for agriculture, municipalities, industry, and private citizens. Thus, 15 million gallons per day for bioethanol would represent only 1% of total withdrawals. But it is an incremental withdrawal from an already unsustainable resource. Current water withdrawals are much greater than the aquifer’s recharge rate 0.02 to 0.05 foot per year in south-central Nebraska, resulting in up to 190-foot decline in the water table over the past 50 years. It is equivalent to “mining” the water resource, and the loss of the resource is essentially irreversible.


All biofuel facilities require process water to convert biomass to fuel. Water used in the biorefining process is modest in absolute terms compared to the water applied and consumed in growing the plants used to produce ethanol. However, because this water use is concentrated into a smaller area, its effects can be substantial locally. A biorefinery that produces 100 million gallons of ethanol per year would use the equivalent of the water supply for a town of about 5,000 people. Consumptive use of water in biorefineries is largely due to evaporation losses from cooling towers and evaporators during the distillation of ethanol following fermentation. However, consumptive use of water is declining as ethanol producers increasingly incorporate water recycling and develop new methods of converting feedstocks to fuels that increase energy yields while reducing water use.


Water Quality of Waste Streams from Two Existing Ethanol Facilities in Iowa
Click to enlarge.


Ethanol plants have various waste streams. First, salts build up in cooling towers and boilers due to evaporation and scaling, and must be periodically discharged (“blowdown”). Second, the technologies used to make the pure water needed for various parts of the process (e.g., reverse osmosis [RO], ion exchange, iron removal; not shown in Figure 5-1) result in a brine effluent. Under the National Pollutant Discharge Elimination System (NPDES) permits are required from the states to discharge this effluent. These permits often cover total dissolve solids (TDS), acidity, iron, residual chlorine, and total suspended solids. Table 5-1 gives chemical characteristics of waste water from the RO operation and from the cooling tower blowdown for two plants in Iowa. Some violations of NPDES permits have been reported in Iowa and Minnesota from ethanol facilities, primarily for TDS.


KEY POLICY IMPLICATIONS


Subsidy policies for corn ethanol production coupled with low corn prices and high oil prices have driven the dramatic expansion of corn ethanol production over the past several years. These policies have been largely motivated to improve energy security and provide a cleanburning additive for gasoline. As biofuel production expands, and particularly as new cellulosic alternatives are developed, there is a real opportunity to shape policies to also meet objectives related to water use and quality impacts.

As total biofuels production expands to meet national goals, the long-term sustainability of the groundwater and surface water resources used for biofuel feedstocks and production facilities will be key issues to consider. From a water quality perspective, it is vitally important to pursue policies that prevent an increase in total loadings of nutrients, pesticides, and sediments to waterways. It may even be possible to design policies in such a way to reduce loadings across the agricultural sector, for example, those that support the production of feedstocks with lower inputs of nutrients.

Cellulosic feedstocks, which have a lower expected impact on water quality in most cases (with the exception of the excessive removal of corn stover from fields without conservation tillage), could be an important alternative to pursue, keeping in mind that there are many uncertainties regarding the large-scale production of these crops. There may be creative alternatives to a simple subsidy per gallon produced that could help protect water quality. Performance subsidies could be designed to be paid when specific objectives such as energy conversion efficiency and reducing the environmental impacts of feedstock production— especially water quality—are met.

Biofuels production is developing within the context of shifting options and goals related to U.S. energy production. There are several factors to be considered with regard to biofuels production that are outside the scope of this report but warrant consideration. Those factors include: energy return on energy invested including consideration of production of pesticides and fertilizer, running farm machinery and irrigating, harvesting and transporting the crop; the overall “carbon footprint” of biofuels from when the seed is planted to when the fuel is produced; and the “food vs. fuel” concern with the possibility that increased economic incentives could prompt farmers worldwide to grow crops for biofuel production instead of food production.


CONCLUSIONS


Currently, biofuels are a marginal additional stress on water supplies at the regional to local scale. However, significant acceleration of biofuels production could cause much greater water quantity problems depending on where the crops are grown. Growing biofuel crops in areas requiring additional irrigation water from already depleted aquifers is a major concern.

The growth of biofuels in the United States has probably already affected water quality because of the large amount of N and P required to produce corn. The extent of Gulf hypoxia in 2007 is among the three largest mapped to date, and the amount of N applied to the land is also at or near its highest level. If not addressed through policy and technology development, this effect could accelerate as biofuels expand to 15 percent of domestic usage to meet President Bush’s 2017 goal, or to 30 percent of domestic fuel usage as proposed by President Bush as the ultimate goal.

If projected future increases in the use of corn for ethanol production do occur, the increase in harm to water quality could be considerable. Expansion of corn on marginal lands or soils that do not hold nutrients can increase loads of both nutrients and sediments. To avoid deleterious effects, future expansions of biofuels may need to look to perennial crops, like switchgrass, poplars/willows, or prairie polyculture, which will hold the soil and nutrients in place.

To move toward a goal of reducing water impacts of biofuels, a policy bridge will likely be needed to encourage development of new technologies that support cellulosic fuel production and develop both traditional and cellulosic feedstocks that require less water and fertilizer and are optimized for fuel production. Policies that better support agricultural best practices could help maintain or even reduce water quality impacts. Policies which conserve water and prevent the unsustainable withdrawal of water from depleted aquifers could also be formulated.


end National Academy of Sciences
begin Nate...


THE BOTTOM LINE


As discussed often here in the past, biofuels not only have a much lower energy return vis-a-vis conventional crude, but have between one and two orders of magnitude lower in power density, (or how much energy we get per unit of land). Furthermore, in our 'Burning Water' paper, (and alluded to here in this NAS report), biofuels also require significantly more water than even the least efficient fossil fuel systems. There are also concerns about pesticides, nitrate and other environmental impacts. So when replacing energy with a 'substitute', all other things do not usually remain equal. I commend the National Academy scientists for highlighting what will be a central issue in upcoming natural resource science - that of systems, and tradeoffs.

It is highly likely we will have liquid fuel shortages in the not too distant future, either via higher prices, or through actual unavailability or rationing. The chart below (thanks Khebab) shows the progression of year over year declines, in different colored lines, of United States oil production. The trend is reasonably clear. We have found the cheap and easy oil.


Energy and water are but 2 of the central inputs that power our modern society. Many of the key resources are either not currently valued by the market system, or may give too late a market signal of scarcity for effective mitigation. The figure above (not from the NAS report..;) gives a conceptual example of potential tradeoffs that a concerted efforts to increase liquid fuel production (or any limiting variable that has linkages to other limiting inputs) might engender. The columns on the left in blue (and red) are when we are in a perceived liquid fuels shortfall. The columns in purple are hypothetical amounts of resources remaining after a portion has been devoted to an 'increase liquid fuel policy'. Focusing on the limiting input du-jour risks pulling in more resources from the periphery which are currently non-limiters. As can be visualized, successful addition of the variable in shortage may come at a cost, which might not be immediately visible or financially recognized, but a cost nonetheless.

We CAN increase our internal production of transportation liquids. In addition to ethanol and biodiesel, we can use coal-to-liquids via Fischer Tropsch; we can drill the Arctic or Alaska Wildlife Refuge; we can expand land to dedicated energy crops, etc. A joint study of the U.S. Department of Energy and the U.S. Department of Agriculture concludes that the United States could produce 60 billion gallons of ethanol by 2030 through a combination of grain and cellulosic feedstocks, enough to replace 30% of projected U.S. gasoline demand. Scientists and policymakers should be asking them 'at what cost'? When they reply XX billions, the comeback should be 'we didn't mean in $ terms-what are the costs in other scarce inputs needed by society?'. In robbing Peter to pay Paul, we have to realize that Paul is pretty insatiable. Who will we rob after Peter?

The subject of the origins of exponential growth, habituation and "Pauls" addiction to oil will be the subject of next weeks post.

Wednesday, July 25, 2007

The Energy Return on Time

While writing the recent piece on home heating, I was surprised to calculate many different numbers for the energy return on firewood. Though the outputs were only slightly different in quantity of BTUs, there was a wide range of inputs. But the primary reason for the return disparity was the presence of the market economy - those processing firewood for their own use had higher energy returns than those selling wood for profit - the accelerated drying time to process large amounts of wood required an additional wood input which dropped the energy return. Graphically this showed up as a tradeoff between maximizing energy return on TIME versus maximizing energy return on ENERGY. This reminded me that energy return is not a hard-and-fast principle, and also that society, obviously, will optimize its resources based on what it perceives to be its most limiting input(s). However, in an upcoming world constrained by energy, or any limiting variable other than time/money, we can increase our energy available by reducing the return on other inputs, such as time.


[break]

INTRODUCTION - A COMMON FRAMEWORK


I've written several articles here related to net energy:

"Using Hubbert Method on EIA Data - The Tiger Chasing its Tail?"
"A Net Energy Parable -Why is EROI Important?"
"Energy From Wind - A Discussion of the EROI Research"
"Ten Fundamental Principles of Net Energy"
"Peak Oil - Why Smart Folks Disagree - Part II"


Since my thinking and research has changed a bit recently, I'd like to first take a big step back and attempt to simplify things, before moving on to a discussion on energy and time. The post ended up being longer and denser than intended, but I believe it gathers momentum as it goes, like a fallen sasquatch on a ski slope.


Humans use exosomatic energy - we use more energy than our own body can store. We procure this energy from a variety of sources and build infrastructure to harness and deliver it all around the planet. But other than drying our hair and laundry in the sun/wind, most of this energy needs to be found/harnessed/refined and distributed to a new or existing societal infrastructure to be able to provide us with its energy services.
We can measure (or at least estimate) in BTU terms, the planets numerous energy 'capital accounts'. Some stores of energy, like light sweet crude oil are awesome in their energy density and versatility and there is, (or once was) a great deal of them. Other energy sources, like wind via wind turbines, are also impressive in the energy they provide, but it is of a different nature - diffuse, intermittent and renewable. Just like we don't really care about dollars but instead what they buy for us, we don't especially care about energy per se, but rather the energy services it provides. Once we pay for the harnessed energy, how we use it is almost as important as how expensive it was to procure.

SUPPLY AND DEMAND WITH A TWIST

Energy allows us to do work. More energy allows us to do more work (i.e. grow). Societies energy profit from one period to the next, is the sum total of all the harnessed energy itself, less the amount we needed to use to deliver this energy to a socially desirable form. We then have to subtract the amount we waste in its consumption to arrive at whats left -this small fraction is the amount actually used to produce human utility - lets call this E. Let's call the former 3 pieces X, Y and Z respectively. So our entire energy supply snafu can be simplified into X (the energy), Y, the efficiency of harnessing it, and Z, the efficiency of using it. If we cut X (the energy) in half, we can still arrive at the same E by doubling either Y (the efficiency/technology through which we harness the energy) or Z, (the efficiency with which we use the energy). While the Peak Oil problem is mostly specific to liquid fuels, the broader energy problem facing the growth economy is how to maintain/increase E, or be happier/generate the same or greater utility from a smaller E (energy used).

Here at theoildrum.com and other circles discussing our energy future, all things energy basically fall into those 4 areas:

X What is and how big is the energy source? (Actually, X is the sum of all energy sources, x1 (coal), x2(oil)....+xn = X)
Y How efficiently do we harness the energy? (what % of each x gets to the energy service side, after subtracting out energy costs?)
Z How efficiently do we use the harnessed energy in our infrastructure and human systems?
E This is the energy that's actually 'used' after all heat losses have been subtracted. What do we use energy for? Why is it important?

My main points in presenting energy in this framework are 1) X is what it is, and will not change meaningfully on any human time scale unless it is consumed, 2) decreasing Y% and Z% (becoming more efficient at both harnessing or using X) are identical in their impact on E, 3)Though there are physical limits on X, Y and Z, there are none on E, in either direction (except perhaps minimum trophic levels of caloric consumption).

Now that we've dispensed with the energy-world-according-to-Nate, lets move on towards the meat of the post:


A REFRESHER ON NET ENERGY ANALYSIS AND ENERGY RETURN ON INVESTMENT


One method for evaluating alternative energy systems is net energy analysis, which seeks to compare the amount of energy delivered to society by a technology to the total energy required to procure that energy to a socially useful form. Biophysically minded analysts prefer net energy analysis to standard economic analysis because it assesses the progression in the physical scarcity of an energy resource, and therefore is immune to the effects of market imperfections that distort monetary data. Also, because goods and services are produced from the conversion of energy into utility, net energy is a measure of the potential to perform useful work in social/economic systems.

Energy Return on Investment (EROI) is an oft-confused controversial but important subset of net energy analysis. EROI is basically a combined measure of how high of quality/density the original energy source is with the energy cost that the composite of harvesting technologies uses to deliver the energy to the consumptive stage. It is often confused because analysis crosses back and forth between 'Y' and 'Z' in the introductory graphic. (Google Robert Rapier and Vinod Khosla...;) EROI is strictly a measure of energy and its 'harvesting' costs in energy terms, not the efficiency of its use or it's transformation to another energy vehicle. For example, once coal is procured out of the ground at a particular energy return, the decision, and subsequent efficiency loss to turn it into electricity or Fischer-Tropsch diesel, are both part of Z, the consumption whims of society. Each energy technology (e.g. in situ mining for tar sands) is a composite of X and Y in the above graphic - a combination of the density/BTU caliber of the energy source and how much energy it takes to procure it to a useful form.

Combining everything then, x times y for each energy technology (oil, coal, solar, nuclear, etc) gives us the net energy, (or energy surplus) for each of earths energy sources. Add all these together and we get X, which is the current planetary energy resource. Multiply them by Y, and we have how much energy is available for human use. X times Y changes over time, as the race between depletion of high quality stocks/flow sites versus better technology unfolds.


Below is a graphic of the peaking and declining of EROI for Louisiana oil and gas production. Its very similar to an actual production curve - as production peaked and declined, net energy also declined sharply (fortunately we had 49 other states and 50+ other countries to get oil from when this occurred)


Lousiana EROI Profile - Source "Energy and Resource Quality - The Ecology of the Economic Process", Hall, Cleveland and Kaufman, 1986


EROI is an important concept because we live on a finite planet ruled by physical systems subject to entropy. There is only so much low entropy energy present in fossil fuel stocks and solar/tidal flows that can be accessed at a meaningfully positive energy return. If society collectively becomes dependent on a certain aggregate energy gain system and attempts to replace it with a lower energy gain portfolio, keeping all other inputs equal, then a larger % of societies resources (labor, capital, etc) would have to be devoted to energy procurement, leaving less available for hospitals, infrastructure, and bowling, etc. EROI has a trade-off with scale - at low scale, EROI can be very high - at higher and higher scale sizes, EROI eventually declines. What society actually uses is EROI x Scale, which equates to the energy surplus (or net energy). If EROI x Scale of all energy sources declines from year to year, all the dollars in the world can't produce the energy gap that has been created. The missing energy would have to come from efficiency, conservation or demand destruction. A numerical example of a hypothetical society facing declines in net energy can be read here.

There are however, many problems with basing energy decisions solely or primarily on EROI. First, as will be seen below, it is not as physical a number as some would like to believe. Second, it has to be adjusted for societies choice of energy quality and this adjustment makes it follow the dictates of the market, something it was designed to look beyond. Third, any collapse-like implications of lower EROI from a societal perspective are not set in stone - lower system wide EROI could be trumped by higher efficiency or new technologies on the consumption side, at least in theory. Fourth, an EROI figure, either high or low, doesn't tell us about the potential size nor of the timing of the alternative energy technology -my potato crop this year will probably be in excess of 50:1 EROI, but it will only help myself and my neighbors because my entire crop is about 50,000 BTUs worth of potatoes - or about 1/2 gallon of gasoline equivalent. Also, unless one parses environmental impacts into energy terms (which is doable but not at all accurate), EROI (currently) still fails to quantify undesirable energy externalities like increased pollution or ecosystem degradation. Finally, it gives us a narrow metric (though certainly broader than dollars) on one limiting variable (energy) that we may be facing in the future. Energy is probably the most important variable I can think of that propels global society forward, but water, soil, ecosystem services, and greenhouse gas emissions also may play a role in societal functioning at some future date.

Onward..


*SIDEBAR - NET ENERGY AND NATIONAL PETROLEUM COUNCIL FORECAST*


Illustrative Total Liquids Supply. Source: Figure ES-5 of NPC report Executive Summary.


There was not a single mention of net energy in the NPC report released last week. Perhaps the reason that oil companies don't use net energy in normal parlance is that it's really an ecological concept, and not (yet) congruous with the market system. True, if there were unlimited other high quality energy dense resources that comprised societies "X", then oil agencies could reasonably exclude the 'net' from their analysis. As it is, oil is ubiquitous in allowing every aspect of the global capitalist system to flourish. It can be replaced, but so far only by lower energy return liquid fuels or by changing the massively entrenched oil dependent transport infrastructure.

Net energy doesn't have much meaning at the company level. An oil company CFO doesn't say "Joe, I think we have declining EROI on our oil fields - what should we do?" He says - "We have accelerating cost pressures in finding new oil-should we even be drilling for that oil if its costs us $50 a barrel?". From a companies perspective, one looks at the dollar cost of accessing and delivering future production - the more difficult to access fields of the future will likely require more energy, and thus higher prices. This is an economic analysis. But when looked at from a societal perspective, while dollars are certainly important, another phenomenon emerges with declines in the net energy available. If the aggregate of the energy producing (harvesting) sector requires more energy due to depletion of the 'easy' portions of a resource, this energy has to come from what once went to non-energy sectors. So what the NPC is missing in the above graph, is that the projected 'growth' in oil supply will, especially the categories of ethanol, biofuels, tar sands, oil shale, etc. free up much less energy to non-energy society per barrel produced than the original, already used, high EROI oil. Essentially, can we assume that the 100+mbpd shown in 2030 would (if it were actually achieved) still free up the same % of oil and gas to society as it does now? More, or less? If less, then which currently productive sectors of the economy will this energy come from (electricity, natural gas and oil products)? Are agencies like the NPC responsible for this type of analysis? If not, then who is?


THE ENERGY RETURN OF FIREWOOD


Ok. Sorry for the long preamble. We now arrive at the central point of this post, which is that energy, due to human decisions on their inputs to Y and use of Z, is perpetually in a tradeoff with time. Recently, an oildrum post showed the potential scale of the forests in the United States were they to be used for heat/firewood. This analysis was 'gross' and did not take into account how much energy it would require to harvest and transport all the wood. While we are in reality not going to accomplish or even attempt this (I hope not), I learned many things from working through the numbers.

THE ANALYSIS

I interviewed 7 firewood 'experts' (Thanks to Hans, Gene, Lynn, Oildrum readers Vtpeaknik and Johnwilder, Whitey and my father), (I consider my father an expert...;) who have been harvesting repeatedly for a number of years - 2 were 'professional' firewood vendors (one in WI, and one in VT) and the other 4 procured the wood themselves for their own use in WI, VT, ME and AK. The energy needed to get firewood is a) to chop down the tree b) to buck it up into transportable pieces, c)to tranport it to the place where it will be d)split and e)dried (green wood has too high of moisture content to burn). Finally, f)it had to be transported again to its final place of consumption.

I came up with a range of EROIs for firewood from 7:1 to 100:1. Yes, thats what I thought - how could something with an equivalent energy output have such disparate energy returns? The math for 2 of the study cases is below:

Example 1 - Gene in Maine
Per Cord
Chainsaw - 3/8 gallon gasoline.
Splitter - 1/2 gallon of gasoline.
Gene uses horses to deliver the wood from the forest to his 'factory'
Feed for the horses (an indirect energy requirement) is also procured by horse/human labor
Wood is air dried from Jan-Feb to September when its delivered (time input 9 months)
Saw rig and conveyor to load in truck for transport to customers- 7/8 gallon of gasoline.
Total loaded in truck - about 1 3/4 gallons of gasoline.
Truck carries one cord and gets 10 mpg.
(I assumed average customer is 5 miles, so 1 gallon round trip)
Time input 8 hours per cord, plus 1 hour for equipment maintenance and 1 hour for horses
or 10 hours of labor per cord
Energy input per cord delivered 2.75 gallons x 115,000 BTU = 316,250 BTUs
Energy output per cord of mixed, dried hardwood = 20,000,000 BTUs
EROI of this particular firewood operation =20,000,000 / 316,250 = 63.25


Note, this does not include the energy inputs into the making of the saws and truck, the food requirements of the horses or Gene, or any of the maintenance of the roads used, or any other 'wide boundary' analyses. (that would be more correct but a heck of a lot of work)

Example 2 - Lynn in Vermont
Buys wood from firewood jobbers - 1/2 gallon per cord for chainsaw
Wood transported average of 5 miles to his firewood company (.5 gallon)
1/2 gallon for splitter
To kiln dry the wood (and have a 5 day turnaround time, year round)
Lynn uses 1 unit of 'crap wood' for each 8 units of salable firewood
Average customer distance for the 2,000+ cords per year - 20 miles but his truck holds 2 cords so 2 gallons round turn
Labor estimate 3 hours per cord
Time estimate - turnaround time 1 week
Energy inputs 4 gallons x 115,000 BTU
1/8 cord of wood =1/8 X 20,000,000 =2,500,000
Energy output = 20,000,000 per cord
Energy input = 3,075,000
EROI of firewood operation #2 = 20,000,000/ 3,075,000 = 6.75


The other 5 people I interviewed had a variety of similar inputs and their EROI calclulation ranged from 18:1 to 100:1 (the 100:1 was a person who chopped the wood by hand and required 52 hours per cord of labor).


Takeaways:

Clearly there are tradeoffs in the procurement of firewood between time, labor and energy. To mass produce, or to do things in a hurry (for reasons other than mass producing), using part of the lower quality scrap wood to quickly dry the wood reduces the energy return but increases not only the profit margin but the EROTI (Energy Return on Time Invested). Alternatively, using extra time and the 'free' drying heat of the sun dramatically increases the energy return but gives a lower return on both labor and EROTI. While this example may be unique to this particular subset of X (forest biomass), we see this phenomenon as well in oil production. Bottlebrush extraction, horizontal well drilling and other new technologies access more parts of an oil field simultaneously, at a higher energy cost, in order to bring them to market faster than traditional slower methods. I don't have ready access to this data, but presumably we could increase the EROI of oil or at least stem the decline from over 100:1 in 1930 down to 10-20:1 earlier this decade (anecdotally this has dropped even further of late in the US), were we to suck on the straw a little slower.

TIME AND ENERGY ALSO HAVE TRADEOFFS ON THE CONSUMPTION SIDE


"But the rate at which new energy technologies, especially conservation, will in fact be introduced will depend on how we perceive the trade-off between time and other resources, and our sophistication and understanding of the new technologies. Thus a conservation measure doesn't happen automatically: it happens only if the economic penalties imposed by not conserving outweigh, in the individual's perception, the loss of time that the conservation measure entails; or if the individual can be persuaded to take a view of the future that is long range enough to justify his investing in the additional capital equipment necessary to save energy over the long run".(4) Alvin Weinberg, 1979


Once in the consumers control, energy again undergoes entropy, going from a low entropy high value substance that is paid for with money, to a high entropy, low value heat waste product (e.g. at 10-15% efficiency, 80-85% of the energy used in the internal combustion engine of an automobile is dissipated as wasted heat). Overspeeding, overlighting, overdrying, overlighting are all examples of how the average efficiency of our energy use declines.

As the introductory graphic explained, a high energy gain technology/energy source means we can be more profligate with how we spend energy. Similarly a lower energy gain system, especially compared to what we've built our infrastructure around, will require high energy gain substitutes, or corresponding increases in efficiency of the energy services we use for human utility. Time also impedes the 'efficiency' with which we use energy. One example that everyone is familiar with is driving. To get the most mileage per gallon, we would have to drive at speeds at or below the speed limit, depending on the size/type of car we are driving. Very low speeds don't generate enough force to overcome engine baseline and idle, very high speeds get us to where we are going faster, but at a cost of using considerably more energy.


The tradeoff between time and energy in gas mileage of various size automobiles
D. Spreng "Time, Information and Energy Conservation" (2) (Click to Enlarge)


Here is a calculated example on an electric car (Prius) with values based on 68F, at sea level, with no A/C or wind.


The maximum return on energy for this car is at 32 mpg. (The maximum return on time would be as fast as one could safely drive.) The electric assist appears to help up to around 42 mph, at which point the engine starts to spin up, and mileage quickly falls off a cliff, and then continues to decrease more gradually as speed rises. (The shape of the graph could also only have come from a car with a continuously variable transmission - other than the transition where the internal combustion engine spins up, there are no obvious "steps" in the plot.) (source)


For most cars, a sharp dropoff in 'energy return' (which we usually call engine efficiency), starts at around 40-50 mph.


(Source)


Interestingly, going 50 mph gets twice the gas mileage (roughly) as going 100 mph. So its takes twice as long to get there but costs 1/2 as much.

THE MAXIMUM POWER PRINCIPLE


It is no surprise that people want to optimize their return on time, especially when a) energy and other basic requirements are currently cheap and b) we have a genetic propensity (amplified by culture) to steeply value the present over the future. The market optimizes dollars, via positive interest rates (which are based on time). If one has more time, one can effect more iterations of a money making process.

The tradeoff between time and energy is consistent with but slightly different than Lotka's and Odum's Maximum Power Principle, which states that organisms and ecosystems arrange themselves not by efficient energy use but by the maximum rate*flow of energy they can harness from the surrounding environment. Some even claim this organizing principle is the 4th law of thermodynamics. Late Tuesday night, I've decided the parallels of time/energy with the maximum power principle will require a subsequent post, (adding it to the list) but the fact that maximum power is achieved through the compromise between speed and efficiency of energy conversions at intermediate efficiencies is a well known biological concept(6). It's quite possible that the market, in a culture of resource extraction is the ultimate vehicle to pursue maximum power - power being represented by status which is currently correlated with dollars in digitized storage. However, I did find a fascinating paper, "On Ungulate Foraging Strategy - Energy Maximizers or Time Minimizers" which disputes some of the earlier ecological work asserting that animals maximize on power/energy. This study showed that bison, a prey animal, do in fact choose to optimize time, rather than energy intake, presumably to have more of their day to pursue other fitness increasing events (watching out for predators and finding really attractive bison). Clearly there are evolutionary forces that draw organisms to choose between energy maximization and time maximization - to me this seems like fertile ground for more research (if there is time...;)


Eighth, in a compelling harmony with all the above thoughts we should cure ourselves of what I have been calling "the circumdrome of the shaving machine", which is to shave oneself faster so as to have more time to work on a machine that shaves faster so as to have more time to work on a machine that shaves still faster, and so on ad infinitum. This change will call for a great deal of recanting on the part of all those professions which have lured man into this empty infinite regress. We must come to realize that an important prerequisite for a good life is a substantial amount of leisure spent in an intelligent manner." Nicolai Georgescu-Roegen Energy and Economic Myths


ON ENERGY AND TIME - THE REALLY BIG PICTURE


We live on a planet of entropy, though its process it much too slow for us to notice. The first law of thermodynamics states that energy can not be created nor destroyed, only changed. The second law (the entropy law) states that low entropy (high potential) energy gradually but inexorably gets changed and degraded to high entropy (low potential) waste - each transformation results in a % of the original energy being lost as heat. Entropy can be slowed by leaving the low entropy sources alone, harnessing them more efficiently, or using their services more efficiently. Entropy can be hastened by opening the energy service spigot wider and wider, and using energy with little attention to how much is wasted. Unnoticed by everyone involved (except me, because Im writing this), my morning drive to Starbucks today took what was 1 gallon of high quality oil from beneath the sand in Saudi Arabia, and translated it to: a tiny amount of work for a great many people, a 30 minute joyous freedom-ride at 60 mph on a beautiful day, an unneccesary but pleasant jolt of hot caffeine, and about 115,000 BTUs dissipated into the earths atmosphere as heat, never to be used again. ( I could have, were my priorities different, chosen to raise the temperature of 115,000 pounds of water by 1 degree Celsius - ahhh freedom.)

In this sense, energy is time itself, for once ALL usable energy is gone, and our sun reaches heat death, physically speaking time itself will cease to exist - for what is time other than a way to measure the process of entropy?(7) Amazingly, each American born today can be expected to live 77+/- years, and extrapolating the current roughly 60 barrel of oil equivalent per year use by the average American, use over 4,600 barrels of oil equivalent of energy during their lifetimes. (Note: at 1 trillion barrels of global URR (ultimate recoverable reserves), that works out to 130 barrels per person for all time, and thats NOT including the impact of net energy). Looks like the 4,470+ will have to come from something other than oil, or we'll have to cut down on lifespan, or energy use per year, or both.

What if a magic machine that could allow each of us as individuals to allocate between energy and time for our own lives? How many people would choose to live to be 154 years old (77*2) but only use 30 boe per year (60/2)? My bet is quite a few. Take that a step further. How many would be willing to live to be 770 years old but only use 6 barrels of oil equivalent per year? Still some, but 770 years might get boring - thats a heck of a lot of Gilligans Island reruns - also 6 barrels per year isnt too many. How many would choose to live to be 7700 years old while using 6/10s a barrel per year of energy? Probably far fewer, (except for the vampires..;) The point being, not only is there a continuum between energy and time, but also of quality of life! People will and should conserve, but will they and should they beyond the point where there lives are improved. In this sense, I visualize a triad between energy, time, and quality, each having minimum values, beyond which steps towards one of the 3 are offset/substituted by one of the other two - we can increase in quality by decreasing our return on energy or time - we can increase our return on energy, by reducing our return on time, or quality, or some such concept.

CONCLUSIONS


Net energy is a physical measurement but can be meaningfully influenced by cultural valuations of other inputs (e.g. time). To me, net energy is most important in the following 2 senses: 1) given that we are beginning to acknowledge that the market does not provide perfect information, using net energy analysis to compare mitigation/adaptation strategies for the coming era of oil depletion is like looking 2 cars ahead in a snowstorm (the market is fixated on just the car taillights ahead). In this way one gets a truer sense of whats really happening up ahead because decisions are based on (at least partially) physical principles. Second, society continues to grow on a certain summation of energy density/quality and BTU total. As we exhaust the low hanging energy fruits, not only in oil, but in hydroelectric, coal, and other sources, to find the remaining, lower quality/density sources, more energy will have to be used. This energy doesn’t come from the sky, but will be subtracted from the also declining amount of oil, natural gas, and electricity produced annually. Therefore the combination of these new energy technologies with end-use consumer efficiency improvements will have to overcome depletion and the increased energy requirement needed for lower EROI sources in order to maintain economic growth. Its really quite simple.

Ironically, net energy principles only purely work when time is not a factor. Given unlimited mitigation time, policymakers can use net energy analysis to determine the best use for our remaining high energy gain assets. But if fuel shortages develop, fixed infrastructure on the current declining energy return technologies may deliver more of an energy service payload to society than a new investment and scaling up of new technologies due to time lags.

The market is expensive in it's use of energy, not the least of reasons is that it incentivizes us to repeat iterations making money as often and quickly as possible. Getting things done quicker is much more important than getting them done using less energy. The market mechanism can coexist with oil depletion, but rules will eventually have to be created that coordinate our expected energy profit with our "E" (actual energy used), limit energy waste, choose what E brings the most meaningful and consistent human utility, and perhaps reduce our EROTI- energy return on time, thereby boosting the return on energy, or whatever the limiting factor is to human systems. A return to slower ways may not only provide us with more energy, but make us happier at the same time. How to get there?

Nathan John Hagens
The University of Vermont
www.theoildrum.com
email nate at theoildrum dot com

Next Up "On The Origins of Exponential Growth, Part I"

(1) Bergman et Al, "Ungulate Foraging Strategies: Energy Maximizing, or Time Minimizing?"(pdf) Journal of Animal Ecology 2001:70,289-300

(2) Spreng D. "Time, Information and Energy Conservation" ORAU/IEA-78-22(R), Institute for Energy Analysis, Oak Ridge Associated
Universities, Oak Ridge, Tennessee, December 1978.

(3)Hall, Charles "The Continuing Importance of Maximum Power", Ecological Modeling 178-(2004) 107-113

(4) Weinberg, A. "Are The Alternative Energy Strategies Achievable?" ORAU/IEA 79-15 (O) Institute for Energy Analysis, Oak Ridge Associated
Universities, Oak Ridge, Tennessee, September 1979.

(5)Georgescu-Roegen, N. Energy and Economic Myths

(6)Smith, C. "When and How Much to Reproduce? The Tradeoff Between Power and Efficiency" American Zoologist 1976 16(4):763-774

(7) Rifkin, J. "The Entropy Law" 1982

Wednesday, July 11, 2007

Old Sunlight Vs Ancient Sunlight - An Analysis of Home Heating and Wood

As the longest day of the year is just past, we begin the inexorable annual trajectory towards winter. A short fifty years ago, people heated their homes in winter with coal. A hundred years ago and before, people living in cold climates largely stayed warm in winter with firewood. Today, in a country (and planet) with vastly more people, we heat homes in northern climates largely with high quality fossil fuels, specifically natural gas, heating oil, and propane. Trees, a less energy-dense form of stored sunlight than oil and gas, have recovered a good part of their former % of landcover in the US, despite being still used for paper, wood, furniture, pulp and some heat. Below is an analysis of how the US residential sector heats its homes, how large are our forests and how much they grow and how much wood we could use for heat, after fossil fuels decline.


Vermont - Circa 1860 Where are the Trees?


[break]

INTRODUCTION


Peak oil and Peak Natural Gas have so many implications that I could think of a new one (and write about it) pretty much daily. In a recent discussion of the depletion of high quality fossil fuels with a neighbor - she quipped "Well - I guess its time to buy a woodstove then". It was the same day that the EIA heating oil inventories had dropped sharply. This got me to thinking, which resulted in the below analysis of how much heat from fossil sources we currently use and how much could be generated from our forests.

At some point in the next decade, perhaps later, probably sooner, we will likely be faced with liquid fuels shortages. Coincident with the decline in high quality oil production, a portfolio of alternative energy sources will be sought out to fill the gaps, both on the macro scale and by individuals. Already given increases in heating oil and natural gas prices, there is renewed interest in using alternatives to fossil fuels. Consumer switching ability for home heating exists, as it did in the 1970’s, but in today’s world we have little choice but to go southwards on the energy pyramid (oil/NG to wood or coal) as opposed to the lateral movement 25 years ago (oil to NG and propane) (Natural gas has more hydrogen atoms than does oil, and both have more than wood).

What if some of the TOD and private forecasts for dramatically higher oil and gas prices occur in the coming years? People quickly respond to these price signals, and may increasingly look to heat their homes using more traditional means that they can individually control. Trees are ubiquitous, and it takes but some money or effort to create a nice neat stack of warmth producing wood next to ones home, especially for the more rural dwellings in our nation. Living in Vermont and buying firewood for my woodstove has made me ponder the following questions: What if everyone wanted/needed to heat with trees at the same time? Would there be enough trees to go around? What is the annual biomass ‘interest’ vs. existing forest ‘capital’? Could any states replace their winter heating requirements sustainably from forests? (note: the Drupal spell check is telling me 'sustainably' is not a word...;) What would be the environmental impact of over-harvesting for heat? Would home heating demand for wood then displace other wood uses, (electricity, lumber, paper, etc.)

(A special thank you to long time oildrum contributor and GIS whiz, Luis a de Sousa, for helping create the GIS images of the United States).


CURRENT HOME HEATING MIX


The US uses over 7 quadrillion BTUs (quads - written 7,000,000,000,000,000) for heating our homes each winter (out of 100 quads total energy use). Heating needs are a function of a) cold temperatures, b) population and c) efficiency of heating method (I suppose I could add d)tolerance/preference). As seen in the below graphic, natural gas is by far and away our largest source of residential home heat, followed by heating oil and propane, which is a product of both natural gas and crude oil refining.


2004-2005 United States residential heating BTUs, in quadrillion units (quads) Click to enlarge. Source: EIA and Propane Council.


HOME HEATING DATA

Some notes on the data. Heating oil is the combined total of distillate #1, distillate #2 and kerosene, though the vast majority is distillate #2. Home heating use of distillate fuel (essentially diesel) is about 10% of total distillate use. (highway trucking is over 50%) (Source). I used 2004-2005 heating data partially because it was easier to find but also because the last 2 winters were among the lowest in the last 30 years as far as fuel usage. 2001 and 2003 were considerably higher (11% and 13%). 2004-2005 was close to the average of the last 7 years. There are a small number of homes that still heat directly with coal but good data doesn't exist so coal was excluded from the analysis. I don't particularly trust the EIA data on wood either as it appears they use the amount of firewood purchased and reported so those numbers may be light because of do-it-yourselfers are not good at reporting-it-to-authorities. Also excluded were heat generating sources/devices like the sun, better insulation, extra blankets or dogs, cats and spouses. In the broadest sense, these are very real heat sources, but they should still be there after fossil fuels decline.


Electricity makes up a minor part of home heating use - of course, there is also natural gas and coal used as a precursors to electricity but I didn't extend this analysis that far. (About half of all energy used by a household goes to heat and cool the home. (116 billion kWh (2001) = 116 billion * 3,413 Btu = 396 trillion BTUs (.396 quads))

US residential heating is dominated by natural gas - more than 2/3 of our home heating is derived from piped natural gas. Below is a historical graph of demand for this largest component of heat in the United States.


Historical United States usage of natural gas for home heating, in quadrillion units (quads) Click to enlarge. Source: Energy Information Agency.


Current county by county United States usage of propane for home heating, dark blue >25%, light blue 10-25%, tan <10% Click to enlarge. Source: US Propane Council.


In 2005, 18.895 billion gallons of propane were sold in the U.S. 7.942 billion gallons were sold to residential users. At 92000 BTU per gallon this equated to about 6% of our residential heat needs. The above graphic illustrates that propane (LPG) is primarily used out West, and in the more rural areas that may not have natural gas pipelines or consistent oil access.


United States natural gas and heating oil use in millions of BTUs per person .


Heating demand is essentially a function of population and cold (temperatures). The above graphic shows the intensity of fossil BTU use for home heat per person.

The northeast and midwest have the coldest temperatures (and or the wimpiest people). Maine uses the most heat per person in the United States, but their low population makes the state itself not one of the higher ranked users. Adding the population factor produces the below graphic:


United States natural gas and heating oil use per state in trillions of BTUs.


WOOD AND FORESTS


Humans have used wood since the dawn of civilization and historical scarcities of wood have triggered major technological changes. Wood shortages in Greece taught architects how to exploit solar energy. Thousands of years later, shortages of wood forced England into the fossil fuel era, and it began a widespread use of coal. Englands attraction to America was in no small part due to the scarcity of timber resources in the British empire and the awareness of huge wood resources in the New World. In the United States, the market for coal expanded slowly and it was not until 1885 that a low population density, heavily forested nation burned more coal than wood. Even in the world today over 2 billion people use firewood as their primary fuel source. (1)


United States forest statistics compared to the World - Source National Forest Service (2).


United States land and forest statistics - Source National Forest Service (2).


The US was heavily forested when it was discovered/populated in the 1600s. (note that the 30% decline in last 375 years is by land area not by volume of wood). Though the statistics above mask it, in the 1800s so much wood was used for construction, export and heat that the eastern forests were largely clearcut. Vermont went from 100% down to 40% forest cover and has since rebounded dramatically. According to biologist Stuart L. Pimm the extent of forest cover in the Eastern United States reached its lowest point in 1872 with about 48 per cent compared to the amount of forest cover in 1620. In the last 100 years, the amount of forest, due largely to presidential decree of increasing reserve land and intensive tree planting has generally held steady or increased.


Rates of growing stock growth, removals, and mortality on productive unreserved forest, 1953-2002. Source: USDA Forest Service (Graphic first posted on TOD by Stuart Staniford here).


The US standing forest as of 2002 was 856,000 million cubic feet. The annual growth of this forest is 23,689 million cubic feet, or around 2.5% of the volume. The above graph shows historical trends of growth, removals and mortality on non-reserved forest - the growth on this type of timber is closer to 3% annually. As can be seen, the forest size was gradually growing as annual growth outpaced removals and mortality until recent years. Now the annual growth net of mortality is just about used. There is no rule saying removals cant be above growth - that just portends a smaller forest the following year. (It is unclear how much of the dead wood can or could be used, and decaying woods impact on soil nutrients and ecosystems is beyond the scope of this post.)


Total US forest products for all uses 2002 - Includes Hardwood and Softwood - Total wood used 15.7 billion cubic feet Click to enlarge. Source (2) National Forest Service.


Less than 10% of our wood use currently goes towards fuel use, and even less of this towards heating. The forest service did not break down this category into fuelwood for home heating and other fuel sources, though one can assume the majority is for residential use (though I know my schools city, Burlington, VT uses wood to generate heat and electricity for the public utility). The total use of 15.7 billion cubic feet is less than the annual total growth of 23.69 billion cf, but there is mortality of 6.3 billion cf which needs to be subtracted (though in theory this would have some heat value). Essentially, we are using all of our forests growth right now, even at the same time we are using all time record amounts of coal, oil and near record amounts of natural gas.


Cords per wood (128 cubic feet) per person in individual states. Click to enlarge. Source (2) National Forest Service.


THE ANALYSIS


HOW MANY CORDS OF FIREWOOD GROW IN ONE YEAR?


In 2002, the forested area of the United States contained 856,000,000,000 cubic feet of tree volume, of which 364,000,000,000 cf were hardwoods. (This is the forest capital). (Due to larger amounts of creosote and much lower wood fiber density in softwoods, they are not suitable for conventional firewood and I assumed are not used for heating –in a more advanced analysis this assumption could be relaxed as people could harvest softwoods and replant with hardwoods at least to some extent and/or install external wood burners).

The current annual volume growth is 10.1 billion cubic feet annually (or about 2.5%). Existing usage rate is 5.7 billion cubic feet with an annual mortality rate of 2.7 billion cubic feet. (Interestingly, the mortality rate was at a 50 year high and the USFS admit they do not know the reason for it). For ease of calculation let’s be aggressive and assume that humans can access all of the dead wood for burning. We then have 4.4 bcf of annual growth of potential firewood that is not otherwise being utilized for lumber, electricity or current home heating. At 128 cubic feet per cord, this equates to approximately 34.7 million (more) cords of wood that can be accessed sustainably, without dipping into the forest ‘capital’. If we discontinue other current market uses for the wood we would have 10.1 billion cf or 78.9 million cords of potential firewood per year.


THE ENERGY CONTENT OF FOSSIL FUELS


Each cubic foot of natural gas, depending on its origin, has about 1,027 BTU’s. #2 Heating oil has 149,793 BTU’s per gallon. Kerosene, used in some places for winter heating, produces 134,779 BTUs per gallon. In total, the amount of fossil fuels used for winter heat in the United States equates to over 7,000 Trillion BTU’s. (2001/2, a much colder winter, was 13% higher).


THE ENERGY IN WOOD


Freshly cut wood has over 60% moisture and therefore takes much more effort to release the energy in the wood fibers. Seasoned wood approaches 20% moisture content and releases about 6,400 BTUs per pound of wood. (Pure bone-dry wood tops 8,000 BTUs per pound but is not practical for home use). Almost all wood types create the same amount of BTUs per pound (6,400), but depending on their individual densities and other properties, differ in how many pounds make up 1 cord. Some examples are:

Hickory => 4,327 lbs per cord => 27.7 million BTUs per cord
Red Maple => 2,924 lbs per cord => 18.7 million BTUs per cord
Cottonwood => 2,108 lbs per cord => 13.5 million BTUs per cord
Cedar => 1,913 lbs per cord => 12.2 million BTUs per cord

A complete list of wood types and BTU content per cord can be found here

This analysis assumes one cord of wood typically is about 2400 pounds. We then arrive at 2,400 X 6,400 BTUs =15,360,000 BTUs per cord. Therefore, in the 52 US states, we have 34.7 million cords of annual volume growth of wood available times 15.36 million BTUs per cord => 533 Trillion BTUs that can be presently be accessed sustainably from hardwoods. (If we eschew all other forest products, this number roughly doubles, and if we include softwoods, it roughly doubles again)


PUTTING THE PIECES TOGETHER


Heating with wood is not as efficient as heating with natural gas or #2 heating oil. A significant portion of the heat generated from burning escapes up the flue to dissipate as heat in the atmosphere. Wood stoves and furnaces average about 55% efficiency. This compares to 85% efficiency for natural gas furnaces and 80% for furnaces using #2 heating oil or kerosene. (the lower the efficiency rating the more BTUs of heat is ‘lost’ and unable to provide heat to targeted areas).

So, of the 5,030 trillion BTUs generated by natural gas furnaces in 2004, 85% or 4,275 trillion BTUs went directly to heating, and 15%, or 755 trillion BTUs was dissipated as waste heat. Similarly, of the 998 trillion BTUs generated by heating oil, roughly 80%, or 799 trillion BTUs went directly to heating.

Of the 532 Trillion BTUs that could be generated annually from forest growth, approximately 55% or 297 Trillion BTUs would end up as ‘actual heat’. Natural Gas and Heating Oils collectively generated 5,074 Trillion BTUs of ‘actual heat’. Thus, this analysis indicates that we could sustainably replace 297 / 5,074 Trillion BTUs or 5.8% of fossil fuel home heating use with home heating from wood. Alternatively, the entire United States forest stock of hardwoods contains 364 billion cubic feet of wood, or 2.84 billion cords which would throw off 24,024 Trillion BTUs (note, this is only 24% of the total annual energy usage of the country). So the good news is if we were really cold and sans fossil fuels, we could chop down trees for at least 4 years before the US would resemble Easter Island (24,024/5,074= 4.74 years). On a state by state basis, the distribution would look like the following:


Years of heat in standing forest (hardwood only) in individual states. Click to enlarge. Source (2) National Forest Service.


To see a graphic including softwoods click here


THE ECOLOGY


If there is wide scale deforestation, for heating, ethanol or other uses, we will increase the CO2 in the atmosphere directly through wood burning, and indirectly through loss of soil biomass, not to mention changing the water/irrigation patterns due to increased erosion, etc. An in-depth environmental assessment of over-harvesting the annual growth in wood biomass is beyond the scale of this preliminary analysis, but of course is both relevant and important.

THE ECONOMICS


This last statement suggests that only a moderate amount of switching can occur given macro constraints. Consumers however, do not look at the macro picture of sustainability, but at their own microeconomics. Let’s see how the current rates of $2.70 heating oil and $14 natural gas (retail) stack up to $260/cord.


Cost per Million Btu's (MBtu) Useful Heat Into the Room:

1) Fuel oil at $2.70 per gallon: There are 149,793 Btus per gallon of fuel oil and oil furnace efficiency equals 0.80:
1,000,000 Btu x $2.70/gal
-------------------------------------
149,793 Btu/gal x .80 = $22.84/MBtu

2) Natural gas retail at $14.00/1000 cu ft, 1007 Btu/cu ft, and efficiency equals 0.85:
1,000,000 Btu x $14.00/1000 cu ft
--------------------------------------
1,007 Btu/cu ft x .85 = $16.36/MBtu

3) Wood ( red oak) at $180/ cord, 19.6 MBtu/cord, and efficiency of airtight stove equals 0.55:
1,000,000 Btu x $260/cord
-------------------------------------------
19,600,000 Btu/cord x .55 = $16.70 /MBtu


At today’s approximate prices, the per BTU cost is about equal natural gas and wood but a good deal less than heating oil. For those that own their own trees however, cutting them may prove a substantial savings. Economic theory would suggest that as fossil fuel prices increase, wood prices, as a substitute, will also increase – the large private landholders then may hold the key to whether we dip into the forest bank account when a fuel shortage presents itself.


ADDITIONAL ISSUES TO CONSIDER


1) Technically, since forests and people are not uniformly distributed, and a tree is too large to fit into a woodstove, energy must be used to reduce forests to manageable human chunks (by chainsaws or axes) and then transported to individual houses (by trucks or horses). These tasks mostly require oil. To an individual, the added costs will show up as higher price for cords of wood. To a society, they result in less BTUs available to heat what is needed from the new source. Clearly with NO fossil fuels, to obtain these amounts of BTUs from wood would be unattainable, as one would need chainsaw and transportation ability to cut all but the low hanging fruit in ones yard. So the net BTUS to the system, as opposed to each individual should be considered (in an Energy Returned /Energy Invested sense). Obviously, as with oil, there is a gross resource (which Ive presented here) and a net resource - I expect people in Colorado won't be heating their homes with the trees on Pikes Peak as they would likely be procured only at an energy loss.

1a)(deleted) I decided to make the discussion about wood harvesting, time and net energy a separate post next week as it got long (and interesting...;)

2)Using softwoods, while creating some problems, would increase the available BTUs available annually by 45% or so.

3)Very little of the Southern forests are used for winter heating. In this way, wood could be ‘imported’ if it were necessary. Again – how much would it cost to do this (in $ and energy?)

4)At some harvest point greater than the sustainable harvest of 5.8% of our heating requirements, there would arise externalities from loss of ecosystem services. Clearly the scale does not exist for large increases in the amount of firewood consumed annually without environmental consequences.

5)Walmart, Home Depot and others have recently been selling large quantities of electric heaters. If people are switching to electrical heat due to high fossil fuel prices, this will in turn increase the price of electricity and increase the amount of biomass currently used for electricity production (thereby reducing the amount of wood available for home heat)

6)Most population dense areas, and most new houses, don't easily have the ability to heat with wood. But external burners might be come popular in a hurry if winter heating needs increase in price or availability. In the same vein, most modern houses dont have the ability to NOT heat with natural gas unless modifications are made. This is another example of how fixed vs marginal energy investment will be key - like the automobile, home heating is not just a plug-and-play BTU problem, as there is long lead time necessary to change relevant built infrastructure.

CONCLUSION


This post has been a first look at the comparative scale of our home heating use from fossil fuels vs. more traditional methods. A more rigorous analysis using dynamic systems modeling could eventually be a component of a larger renewable energy meta-analysis.

We are at the very early stages of a Sustainability Revolution, equally momentous for humankind as were the Agricultural and Industrial Revolutions. While no one can know with certainty the timing of the decline in liquid fuels, analysis can be put in place ahead of time to focus our efforts on alternatives and portfolios thereof that collectively give us a chance at sustainability. While there is seemingly a huge inventory of trees in our country, there is also a huge inventory of humans and their respective consumptive wants. Warmth and protection from cold is among the most basic of our human needs – quite simply, there are not enough trees for an annual growth harvest to provide more than a fraction of our current heating needs. I don't really expect we will return to heating with wood, but the point of this exercise is to show that if the market should incentivize people to heat with wood, we have upper limits in expanding our use of wood for heating, and they are not too far from where we are now. This analysis provides yet another example of the power, density and importance of natural gas and oil in our society.


(1) A Forest Journey: The Story of Wood and Civilization, Perlin, Josh,; Countrymen Press 2005

(2) Forest Resources of the United States(large pdf warning), Smith, W. Brad; Miles, Patrick D.; Vissage, John S.; Pugh, Scott A. 2004 General Technical Report NC-241. St. Paul, MN: U.S. Dept. of Agriculture, Forest Service, North Central Research Station (I encourage anyone with an interest in trees and forests etc. to peruse this long pdf - lots of fascinating data)