
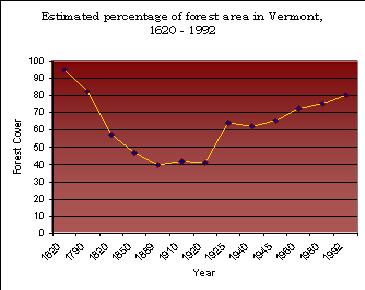
Vermont - Circa 1860 Where are the Trees?
[break]
INTRODUCTION
Peak oil and Peak Natural Gas have so many implications that I could think of a new one (and write about it) pretty much daily. In a recent discussion of the depletion of high quality fossil fuels with a neighbor - she quipped "Well - I guess its time to buy a woodstove then". It was the same day that the EIA heating oil inventories had dropped sharply. This got me to thinking, which resulted in the below analysis of how much heat from fossil sources we currently use and how much could be generated from our forests.
At some point in the next decade, perhaps later, probably sooner, we will likely be faced with liquid fuels shortages. Coincident with the decline in high quality oil production, a portfolio of alternative energy sources will be sought out to fill the gaps, both on the macro scale and by individuals. Already given increases in heating oil and natural gas prices, there is renewed interest in using alternatives to fossil fuels. Consumer switching ability for home heating exists, as it did in the 1970’s, but in today’s world we have little choice but to go southwards on the energy pyramid (oil/NG to wood or coal) as opposed to the lateral movement 25 years ago (oil to NG and propane) (Natural gas has more hydrogen atoms than does oil, and both have more than wood).
What if some of the TOD and private forecasts for dramatically higher oil and gas prices occur in the coming years? People quickly respond to these price signals, and may increasingly look to heat their homes using more traditional means that they can individually control. Trees are ubiquitous, and it takes but some money or effort to create a nice neat stack of warmth producing wood next to ones home, especially for the more rural dwellings in our nation. Living in Vermont and buying firewood for my woodstove has made me ponder the following questions: What if everyone wanted/needed to heat with trees at the same time? Would there be enough trees to go around? What is the annual biomass ‘interest’ vs. existing forest ‘capital’? Could any states replace their winter heating requirements sustainably from forests? (note: the Drupal spell check is telling me 'sustainably' is not a word...;) What would be the environmental impact of over-harvesting for heat? Would home heating demand for wood then displace other wood uses, (electricity, lumber, paper, etc.)
(A special thank you to long time oildrum contributor and GIS whiz, Luis a de Sousa, for helping create the GIS images of the United States).
CURRENT HOME HEATING MIX
The US uses over 7 quadrillion BTUs (quads - written 7,000,000,000,000,000) for heating our homes each winter (out of 100 quads total energy use). Heating needs are a function of a) cold temperatures, b) population and c) efficiency of heating method (I suppose I could add d)tolerance/preference). As seen in the below graphic, natural gas is by far and away our largest source of residential home heat, followed by heating oil and propane, which is a product of both natural gas and crude oil refining.
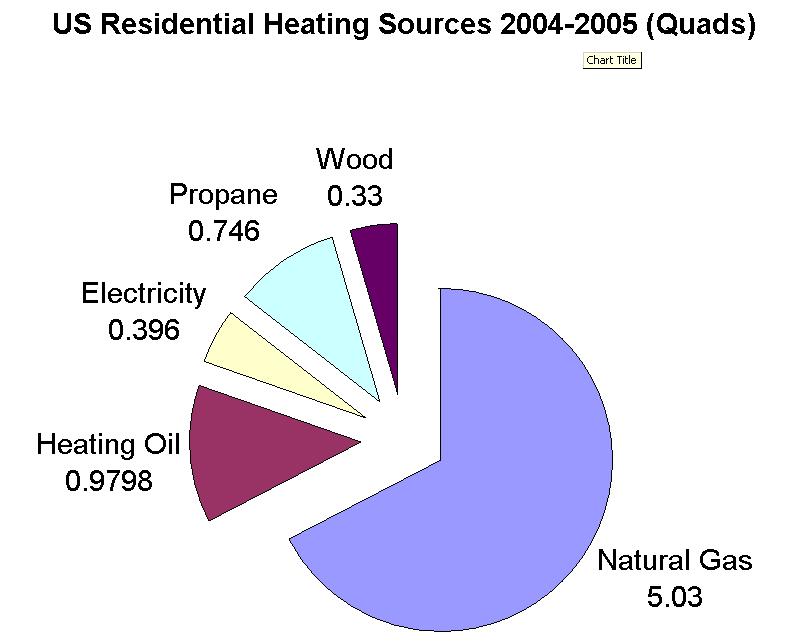
2004-2005 United States residential heating BTUs, in quadrillion units (quads) Click to enlarge. Source: EIA and Propane Council.
HOME HEATING DATA
Some notes on the data. Heating oil is the combined total of distillate #1, distillate #2 and kerosene, though the vast majority is distillate #2. Home heating use of distillate fuel (essentially diesel) is about 10% of total distillate use. (highway trucking is over 50%) (Source). I used 2004-2005 heating data partially because it was easier to find but also because the last 2 winters were among the lowest in the last 30 years as far as fuel usage. 2001 and 2003 were considerably higher (11% and 13%). 2004-2005 was close to the average of the last 7 years. There are a small number of homes that still heat directly with coal but good data doesn't exist so coal was excluded from the analysis. I don't particularly trust the EIA data on wood either as it appears they use the amount of firewood purchased and reported so those numbers may be light because of do-it-yourselfers are not good at reporting-it-to-authorities. Also excluded were heat generating sources/devices like the sun, better insulation, extra blankets or dogs, cats and spouses. In the broadest sense, these are very real heat sources, but they should still be there after fossil fuels decline.
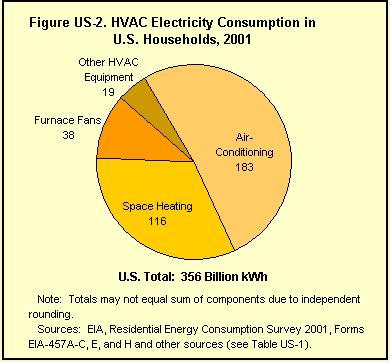
Electricity makes up a minor part of home heating use - of course, there is also natural gas and coal used as a precursors to electricity but I didn't extend this analysis that far. (About half of all energy used by a household goes to heat and cool the home. (116 billion kWh (2001) = 116 billion * 3,413 Btu = 396 trillion BTUs (.396 quads))
US residential heating is dominated by natural gas - more than 2/3 of our home heating is derived from piped natural gas. Below is a historical graph of demand for this largest component of heat in the United States.

Historical United States usage of natural gas for home heating, in quadrillion units (quads) Click to enlarge. Source: Energy Information Agency.

Current county by county United States usage of propane for home heating, dark blue >25%, light blue 10-25%, tan <10% Click to enlarge. Source: US Propane Council.
In 2005, 18.895 billion gallons of propane were sold in the U.S. 7.942 billion gallons were sold to residential users. At 92000 BTU per gallon this equated to about 6% of our residential heat needs. The above graphic illustrates that propane (LPG) is primarily used out West, and in the more rural areas that may not have natural gas pipelines or consistent oil access.

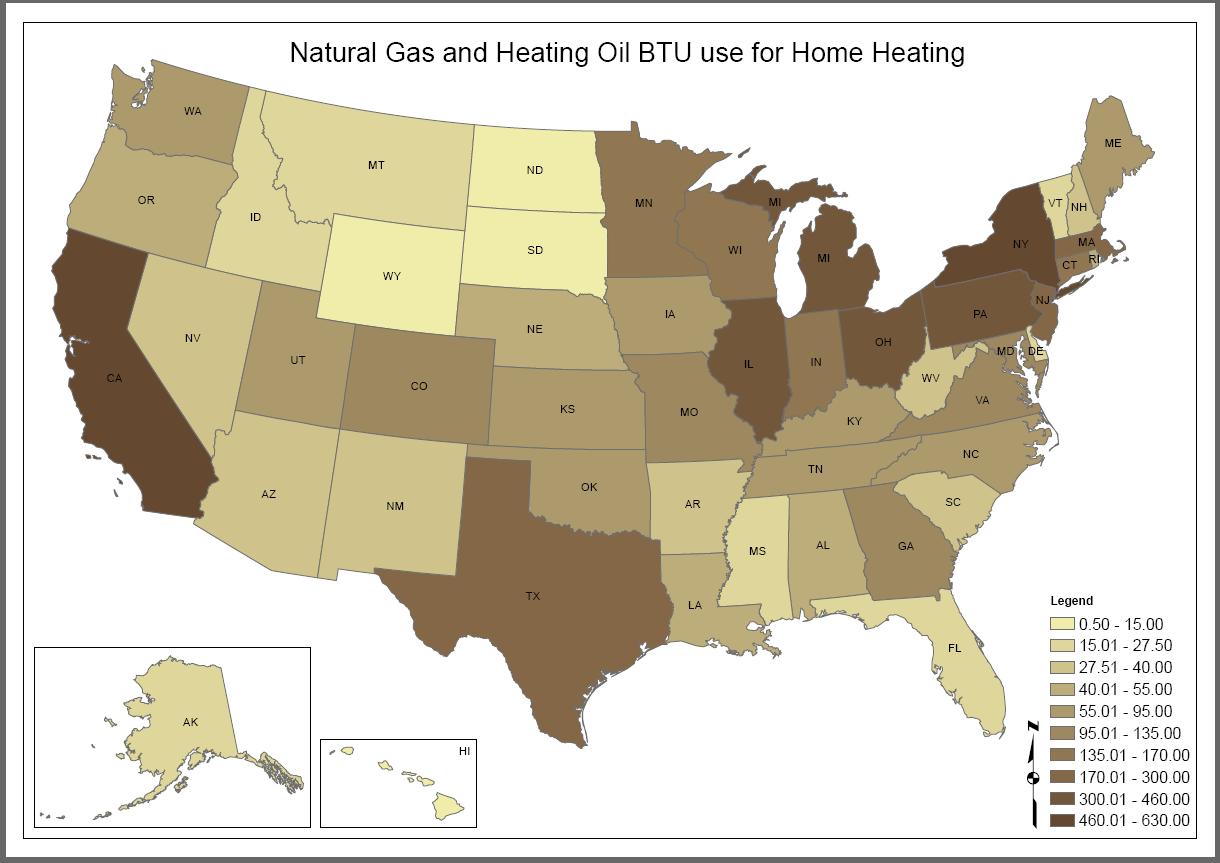
United States natural gas and heating oil use in millions of BTUs per person .
Heating demand is essentially a function of population and cold (temperatures). The above graphic shows the intensity of fossil BTU use for home heat per person.
The northeast and midwest have the coldest temperatures (and or the wimpiest people). Maine uses the most heat per person in the United States, but their low population makes the state itself not one of the higher ranked users. Adding the population factor produces the below graphic:
United States natural gas and heating oil use per state in trillions of BTUs.
WOOD AND FORESTS
Humans have used wood since the dawn of civilization and historical scarcities of wood have triggered major technological changes. Wood shortages in Greece taught architects how to exploit solar energy. Thousands of years later, shortages of wood forced England into the fossil fuel era, and it began a widespread use of coal. Englands attraction to America was in no small part due to the scarcity of timber resources in the British empire and the awareness of huge wood resources in the New World. In the United States, the market for coal expanded slowly and it was not until 1885 that a low population density, heavily forested nation burned more coal than wood. Even in the world today over 2 billion people use firewood as their primary fuel source. (1)
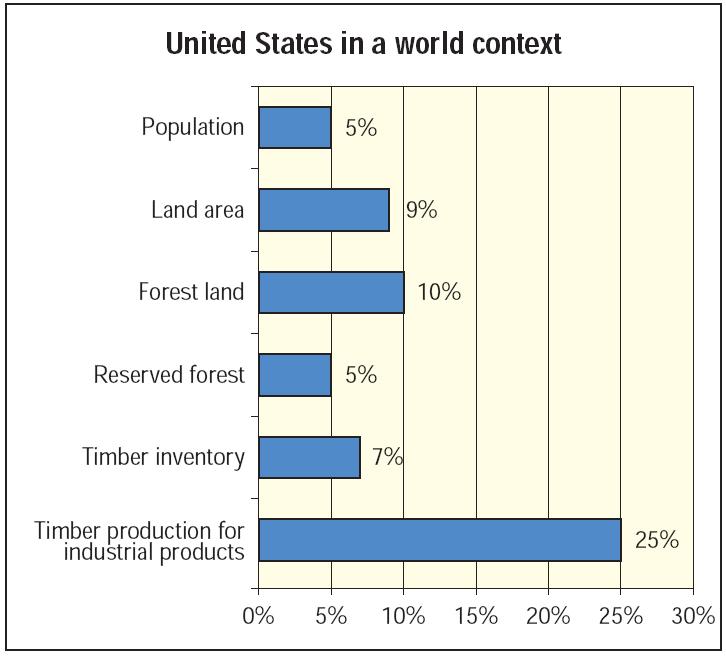
United States forest statistics compared to the World - Source National Forest Service (2).

United States land and forest statistics - Source National Forest Service (2).
The US was heavily forested when it was discovered/populated in the 1600s. (note that the 30% decline in last 375 years is by land area not by volume of wood). Though the statistics above mask it, in the 1800s so much wood was used for construction, export and heat that the eastern forests were largely clearcut. Vermont went from 100% down to 40% forest cover and has since rebounded dramatically. According to biologist Stuart L. Pimm the extent of forest cover in the Eastern United States reached its lowest point in 1872 with about 48 per cent compared to the amount of forest cover in 1620. In the last 100 years, the amount of forest, due largely to presidential decree of increasing reserve land and intensive tree planting has generally held steady or increased.
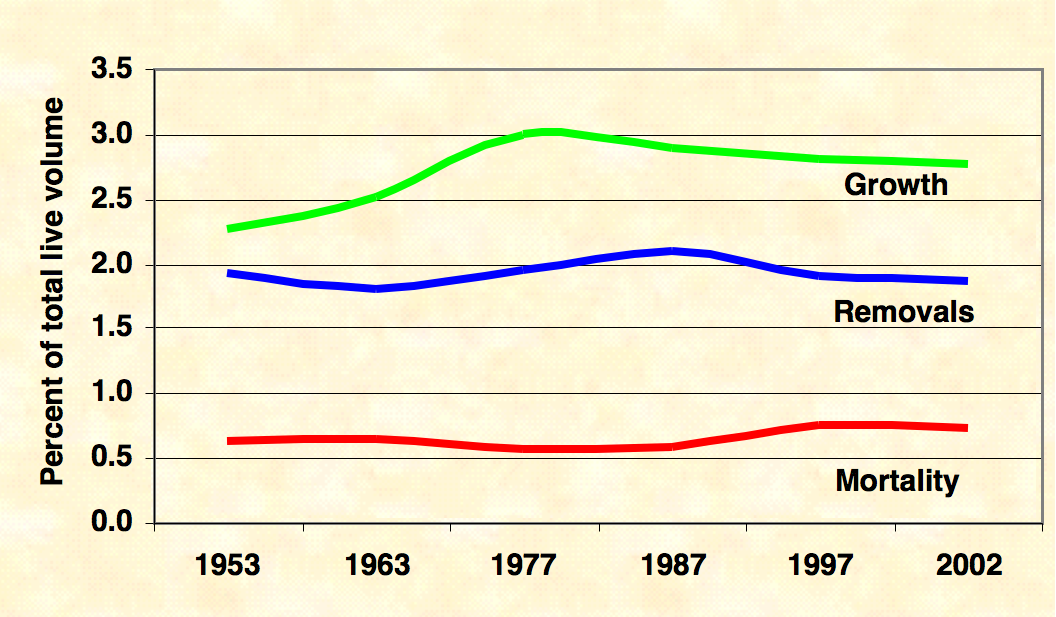
Rates of growing stock growth, removals, and mortality on productive unreserved forest, 1953-2002. Source: USDA Forest Service (Graphic first posted on TOD by Stuart Staniford here).
The US standing forest as of 2002 was 856,000 million cubic feet. The annual growth of this forest is 23,689 million cubic feet, or around 2.5% of the volume. The above graph shows historical trends of growth, removals and mortality on non-reserved forest - the growth on this type of timber is closer to 3% annually. As can be seen, the forest size was gradually growing as annual growth outpaced removals and mortality until recent years. Now the annual growth net of mortality is just about used. There is no rule saying removals cant be above growth - that just portends a smaller forest the following year. (It is unclear how much of the dead wood can or could be used, and decaying woods impact on soil nutrients and ecosystems is beyond the scope of this post.)
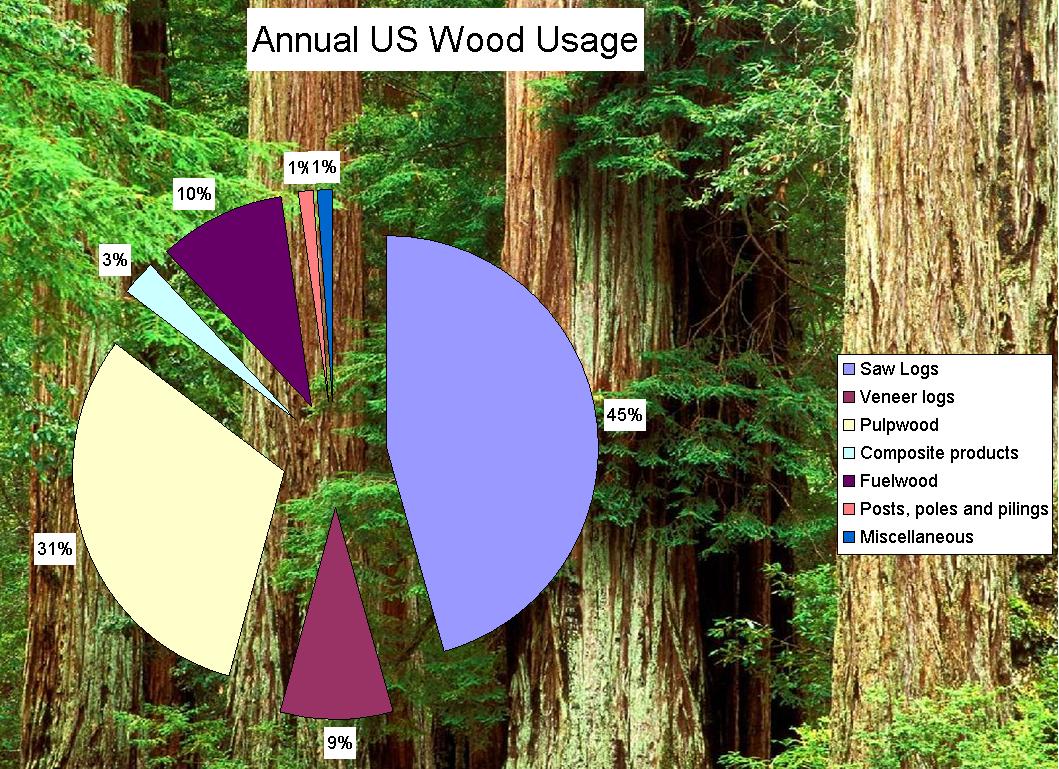
Total US forest products for all uses 2002 - Includes Hardwood and Softwood - Total wood used 15.7 billion cubic feet Click to enlarge. Source (2) National Forest Service.
Less than 10% of our wood use currently goes towards fuel use, and even less of this towards heating. The forest service did not break down this category into fuelwood for home heating and other fuel sources, though one can assume the majority is for residential use (though I know my schools city, Burlington, VT uses wood to generate heat and electricity for the public utility). The total use of 15.7 billion cubic feet is less than the annual total growth of 23.69 billion cf, but there is mortality of 6.3 billion cf which needs to be subtracted (though in theory this would have some heat value). Essentially, we are using all of our forests growth right now, even at the same time we are using all time record amounts of coal, oil and near record amounts of natural gas.

Cords per wood (128 cubic feet) per person in individual states. Click to enlarge. Source (2) National Forest Service.
THE ANALYSIS
HOW MANY CORDS OF FIREWOOD GROW IN ONE YEAR?
In 2002, the forested area of the United States contained 856,000,000,000 cubic feet of tree volume, of which 364,000,000,000 cf were hardwoods. (This is the forest capital). (Due to larger amounts of creosote and much lower wood fiber density in softwoods, they are not suitable for conventional firewood and I assumed are not used for heating –in a more advanced analysis this assumption could be relaxed as people could harvest softwoods and replant with hardwoods at least to some extent and/or install external wood burners).
The current annual volume growth is 10.1 billion cubic feet annually (or about 2.5%). Existing usage rate is 5.7 billion cubic feet with an annual mortality rate of 2.7 billion cubic feet. (Interestingly, the mortality rate was at a 50 year high and the USFS admit they do not know the reason for it). For ease of calculation let’s be aggressive and assume that humans can access all of the dead wood for burning. We then have 4.4 bcf of annual growth of potential firewood that is not otherwise being utilized for lumber, electricity or current home heating. At 128 cubic feet per cord, this equates to approximately 34.7 million (more) cords of wood that can be accessed sustainably, without dipping into the forest ‘capital’. If we discontinue other current market uses for the wood we would have 10.1 billion cf or 78.9 million cords of potential firewood per year.
THE ENERGY CONTENT OF FOSSIL FUELS
Each cubic foot of natural gas, depending on its origin, has about 1,027 BTU’s. #2 Heating oil has 149,793 BTU’s per gallon. Kerosene, used in some places for winter heating, produces 134,779 BTUs per gallon. In total, the amount of fossil fuels used for winter heat in the United States equates to over 7,000 Trillion BTU’s. (2001/2, a much colder winter, was 13% higher).
THE ENERGY IN WOOD
Freshly cut wood has over 60% moisture and therefore takes much more effort to release the energy in the wood fibers. Seasoned wood approaches 20% moisture content and releases about 6,400 BTUs per pound of wood. (Pure bone-dry wood tops 8,000 BTUs per pound but is not practical for home use). Almost all wood types create the same amount of BTUs per pound (6,400), but depending on their individual densities and other properties, differ in how many pounds make up 1 cord. Some examples are:
Hickory => 4,327 lbs per cord => 27.7 million BTUs per cord
Red Maple => 2,924 lbs per cord => 18.7 million BTUs per cord
Cottonwood => 2,108 lbs per cord => 13.5 million BTUs per cord
Cedar => 1,913 lbs per cord => 12.2 million BTUs per cord
A complete list of wood types and BTU content per cord can be found here
This analysis assumes one cord of wood typically is about 2400 pounds. We then arrive at 2,400 X 6,400 BTUs =15,360,000 BTUs per cord. Therefore, in the 52 US states, we have 34.7 million cords of annual volume growth of wood available times 15.36 million BTUs per cord => 533 Trillion BTUs that can be presently be accessed sustainably from hardwoods. (If we eschew all other forest products, this number roughly doubles, and if we include softwoods, it roughly doubles again)
PUTTING THE PIECES TOGETHER
Heating with wood is not as efficient as heating with natural gas or #2 heating oil. A significant portion of the heat generated from burning escapes up the flue to dissipate as heat in the atmosphere. Wood stoves and furnaces average about 55% efficiency. This compares to 85% efficiency for natural gas furnaces and 80% for furnaces using #2 heating oil or kerosene. (the lower the efficiency rating the more BTUs of heat is ‘lost’ and unable to provide heat to targeted areas).
So, of the 5,030 trillion BTUs generated by natural gas furnaces in 2004, 85% or 4,275 trillion BTUs went directly to heating, and 15%, or 755 trillion BTUs was dissipated as waste heat. Similarly, of the 998 trillion BTUs generated by heating oil, roughly 80%, or 799 trillion BTUs went directly to heating.
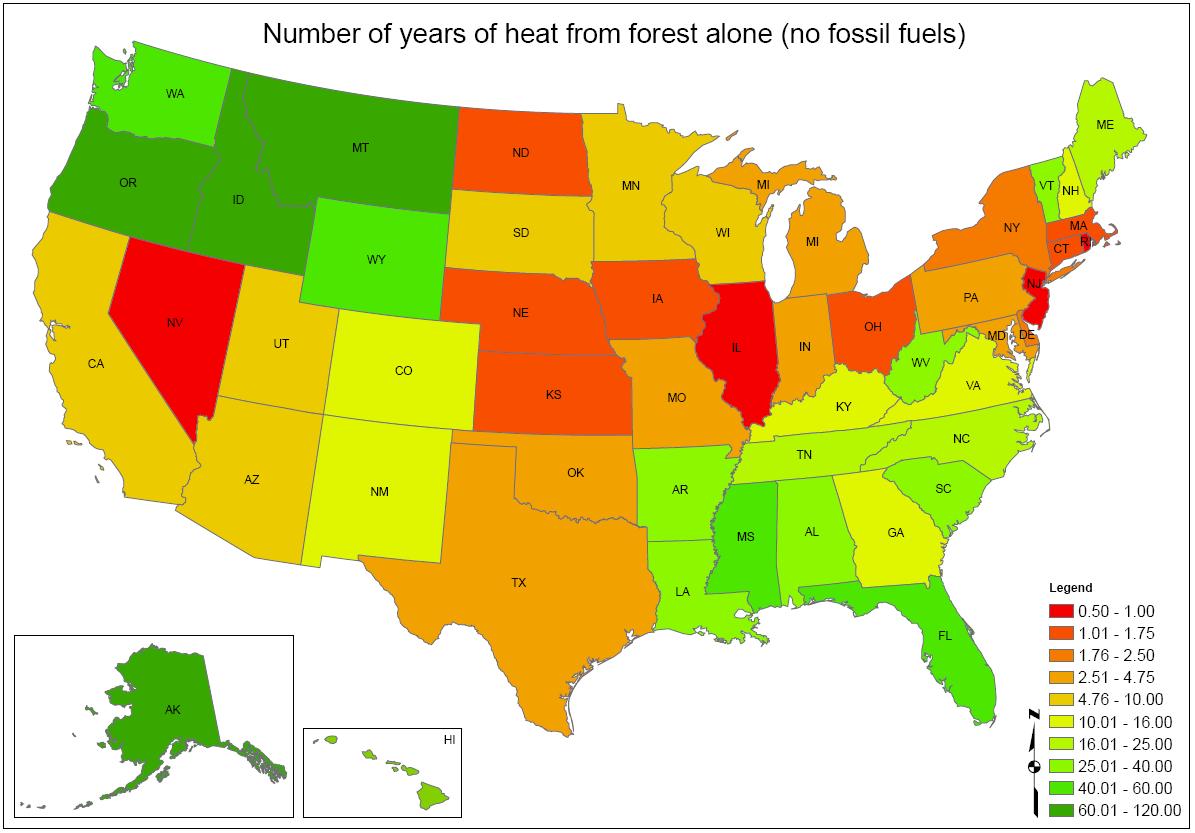
Of the 532 Trillion BTUs that could be generated annually from forest growth, approximately 55% or 297 Trillion BTUs would end up as ‘actual heat’. Natural Gas and Heating Oils collectively generated 5,074 Trillion BTUs of ‘actual heat’. Thus, this analysis indicates that we could sustainably replace 297 / 5,074 Trillion BTUs or 5.8% of fossil fuel home heating use with home heating from wood. Alternatively, the entire United States forest stock of hardwoods contains 364 billion cubic feet of wood, or 2.84 billion cords which would throw off 24,024 Trillion BTUs (note, this is only 24% of the total annual energy usage of the country). So the good news is if we were really cold and sans fossil fuels, we could chop down trees for at least 4 years before the US would resemble Easter Island (24,024/5,074= 4.74 years). On a state by state basis, the distribution would look like the following:
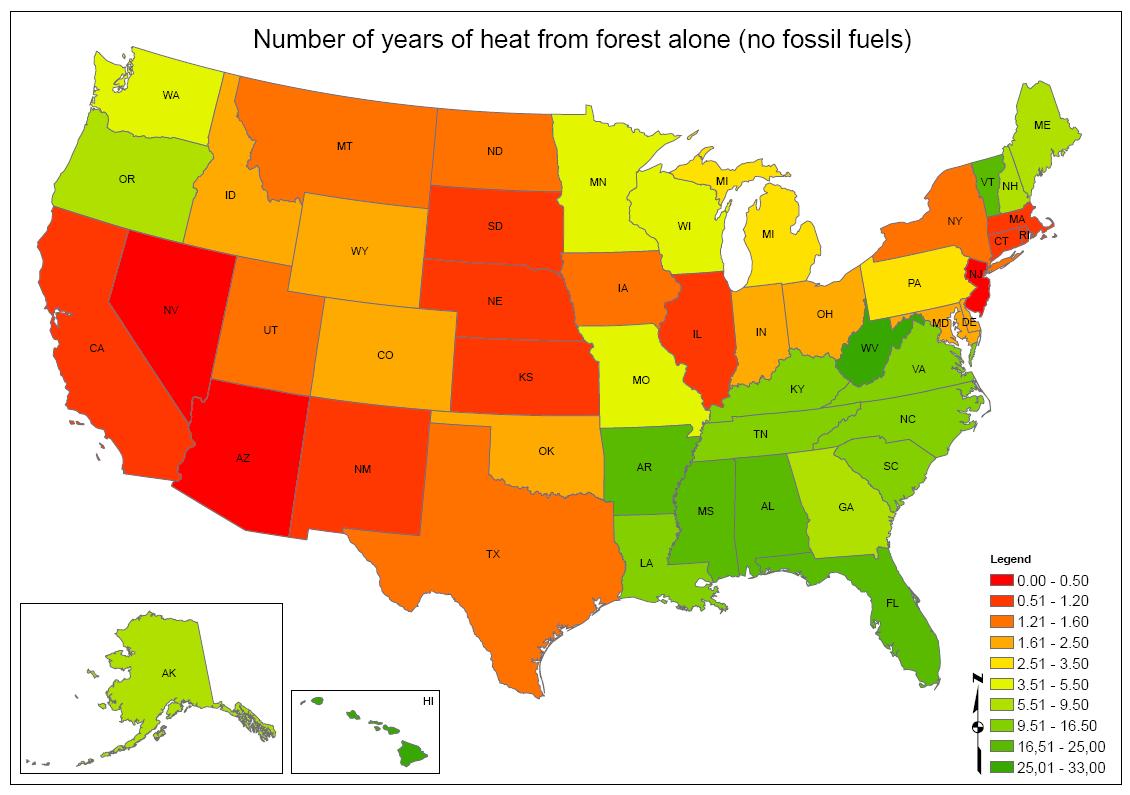
Years of heat in standing forest (hardwood only) in individual states. Click to enlarge. Source (2) National Forest Service.
To see a graphic including softwoods click here
THE ECOLOGY
If there is wide scale deforestation, for heating, ethanol or other uses, we will increase the CO2 in the atmosphere directly through wood burning, and indirectly through loss of soil biomass, not to mention changing the water/irrigation patterns due to increased erosion, etc. An in-depth environmental assessment of over-harvesting the annual growth in wood biomass is beyond the scale of this preliminary analysis, but of course is both relevant and important.
THE ECONOMICS
This last statement suggests that only a moderate amount of switching can occur given macro constraints. Consumers however, do not look at the macro picture of sustainability, but at their own microeconomics. Let’s see how the current rates of $2.70 heating oil and $14 natural gas (retail) stack up to $260/cord.
Cost per Million Btu's (MBtu) Useful Heat Into the Room:
1) Fuel oil at $2.70 per gallon: There are 149,793 Btus per gallon of fuel oil and oil furnace efficiency equals 0.80:
1,000,000 Btu x $2.70/gal
-------------------------------------
149,793 Btu/gal x .80 = $22.84/MBtu
2) Natural gas retail at $14.00/1000 cu ft, 1007 Btu/cu ft, and efficiency equals 0.85:
1,000,000 Btu x $14.00/1000 cu ft
--------------------------------------
1,007 Btu/cu ft x .85 = $16.36/MBtu
3) Wood ( red oak) at $180/ cord, 19.6 MBtu/cord, and efficiency of airtight stove equals 0.55:
1,000,000 Btu x $260/cord
-------------------------------------------
19,600,000 Btu/cord x .55 = $16.70 /MBtu
At today’s approximate prices, the per BTU cost is about equal natural gas and wood but a good deal less than heating oil. For those that own their own trees however, cutting them may prove a substantial savings. Economic theory would suggest that as fossil fuel prices increase, wood prices, as a substitute, will also increase – the large private landholders then may hold the key to whether we dip into the forest bank account when a fuel shortage presents itself.
ADDITIONAL ISSUES TO CONSIDER
1) Technically, since forests and people are not uniformly distributed, and a tree is too large to fit into a woodstove, energy must be used to reduce forests to manageable human chunks (by chainsaws or axes) and then transported to individual houses (by trucks or horses). These tasks mostly require oil. To an individual, the added costs will show up as higher price for cords of wood. To a society, they result in less BTUs available to heat what is needed from the new source. Clearly with NO fossil fuels, to obtain these amounts of BTUs from wood would be unattainable, as one would need chainsaw and transportation ability to cut all but the low hanging fruit in ones yard. So the net BTUS to the system, as opposed to each individual should be considered (in an Energy Returned /Energy Invested sense). Obviously, as with oil, there is a gross resource (which Ive presented here) and a net resource - I expect people in Colorado won't be heating their homes with the trees on Pikes Peak as they would likely be procured only at an energy loss.
1a)(deleted) I decided to make the discussion about wood harvesting, time and net energy a separate post next week as it got long (and interesting...;)
2)Using softwoods, while creating some problems, would increase the available BTUs available annually by 45% or so.
3)Very little of the Southern forests are used for winter heating. In this way, wood could be ‘imported’ if it were necessary. Again – how much would it cost to do this (in $ and energy?)
4)At some harvest point greater than the sustainable harvest of 5.8% of our heating requirements, there would arise externalities from loss of ecosystem services. Clearly the scale does not exist for large increases in the amount of firewood consumed annually without environmental consequences.
5)Walmart, Home Depot and others have recently been selling large quantities of electric heaters. If people are switching to electrical heat due to high fossil fuel prices, this will in turn increase the price of electricity and increase the amount of biomass currently used for electricity production (thereby reducing the amount of wood available for home heat)
6)Most population dense areas, and most new houses, don't easily have the ability to heat with wood. But external burners might be come popular in a hurry if winter heating needs increase in price or availability. In the same vein, most modern houses dont have the ability to NOT heat with natural gas unless modifications are made. This is another example of how fixed vs marginal energy investment will be key - like the automobile, home heating is not just a plug-and-play BTU problem, as there is long lead time necessary to change relevant built infrastructure.
CONCLUSION
This post has been a first look at the comparative scale of our home heating use from fossil fuels vs. more traditional methods. A more rigorous analysis using dynamic systems modeling could eventually be a component of a larger renewable energy meta-analysis.
We are at the very early stages of a Sustainability Revolution, equally momentous for humankind as were the Agricultural and Industrial Revolutions. While no one can know with certainty the timing of the decline in liquid fuels, analysis can be put in place ahead of time to focus our efforts on alternatives and portfolios thereof that collectively give us a chance at sustainability. While there is seemingly a huge inventory of trees in our country, there is also a huge inventory of humans and their respective consumptive wants. Warmth and protection from cold is among the most basic of our human needs – quite simply, there are not enough trees for an annual growth harvest to provide more than a fraction of our current heating needs. I don't really expect we will return to heating with wood, but the point of this exercise is to show that if the market should incentivize people to heat with wood, we have upper limits in expanding our use of wood for heating, and they are not too far from where we are now. This analysis provides yet another example of the power, density and importance of natural gas and oil in our society.
(1) A Forest Journey: The Story of Wood and Civilization, Perlin, Josh,; Countrymen Press 2005
(2) Forest Resources of the United States(large pdf warning), Smith, W. Brad; Miles, Patrick D.; Vissage, John S.; Pugh, Scott A. 2004 General Technical Report NC-241. St. Paul, MN: U.S. Dept. of Agriculture, Forest Service, North Central Research Station (I encourage anyone with an interest in trees and forests etc. to peruse this long pdf - lots of fascinating data)
No comments:
Post a Comment